Key features of Workbook and Simulation
Workbook
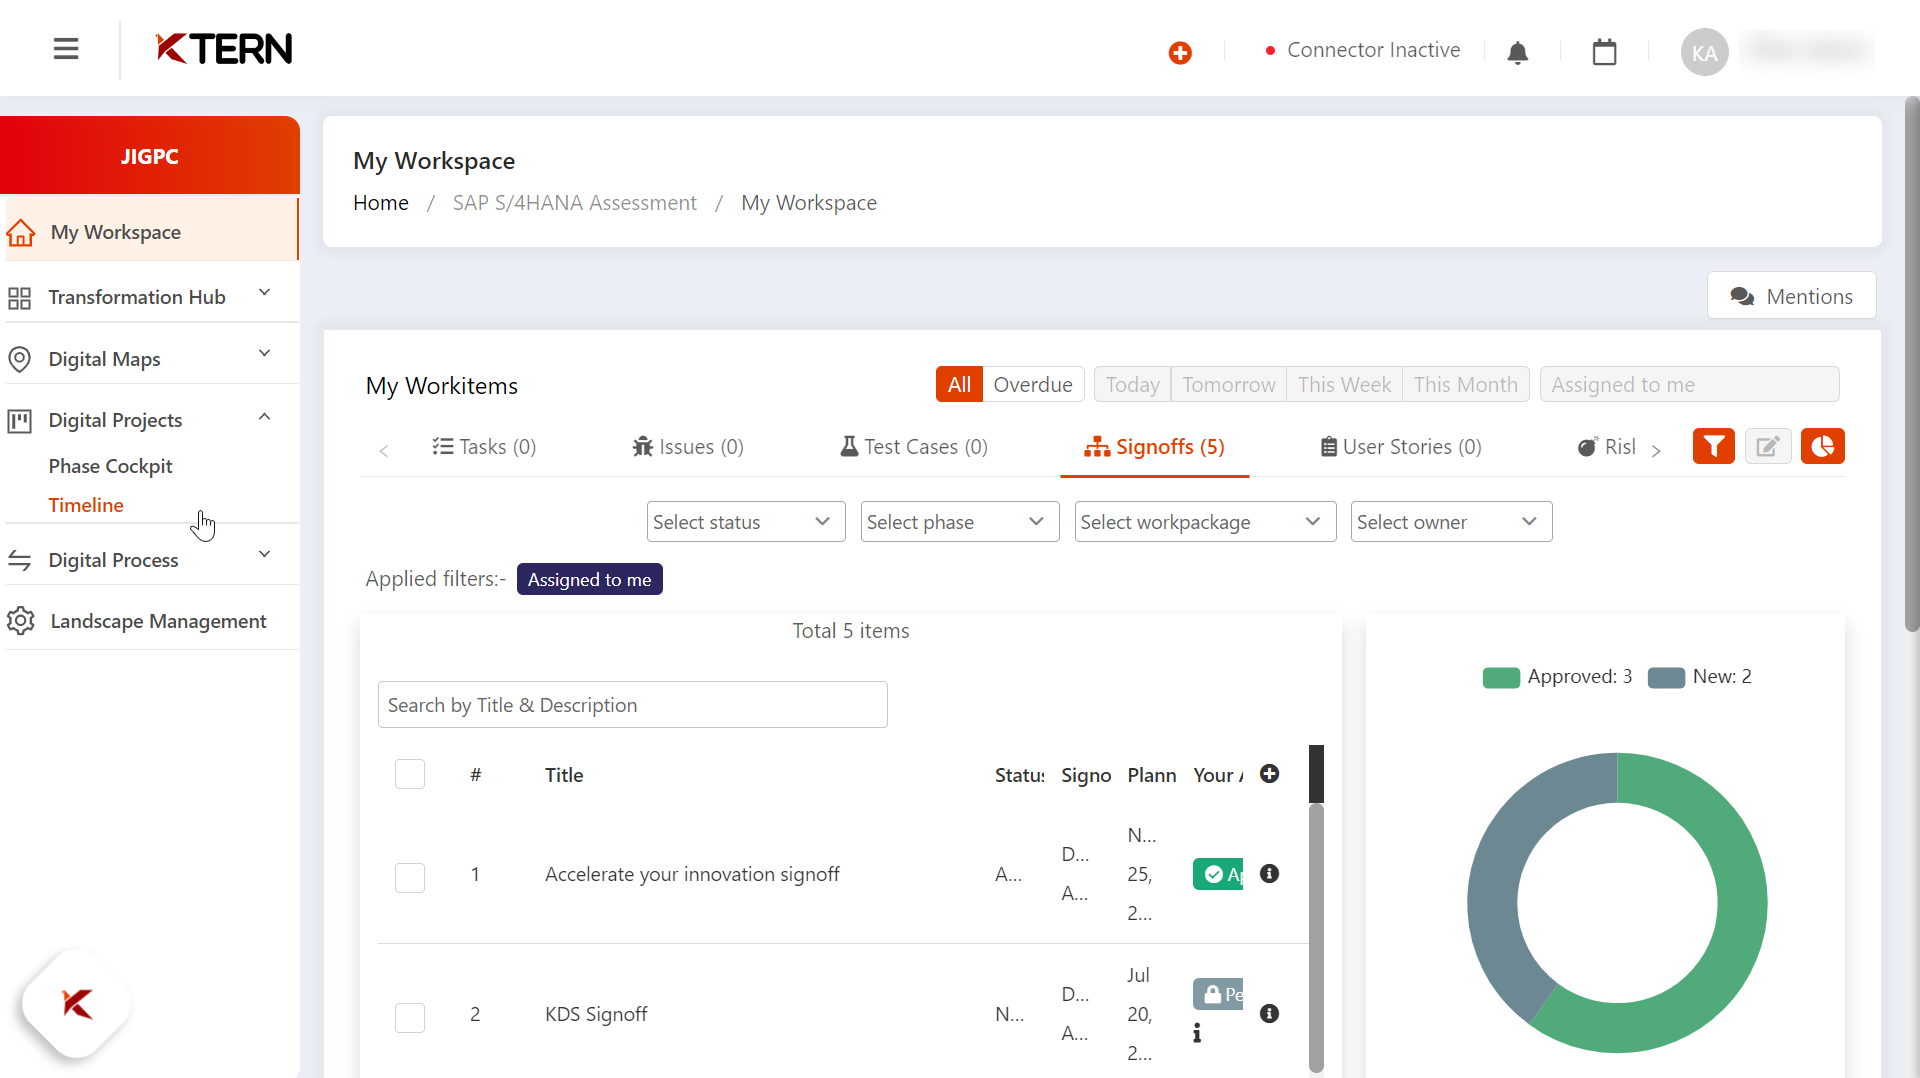
- After getting into the desired project upon logging into KTern, the user will be redirected to the "My Workspace" page.
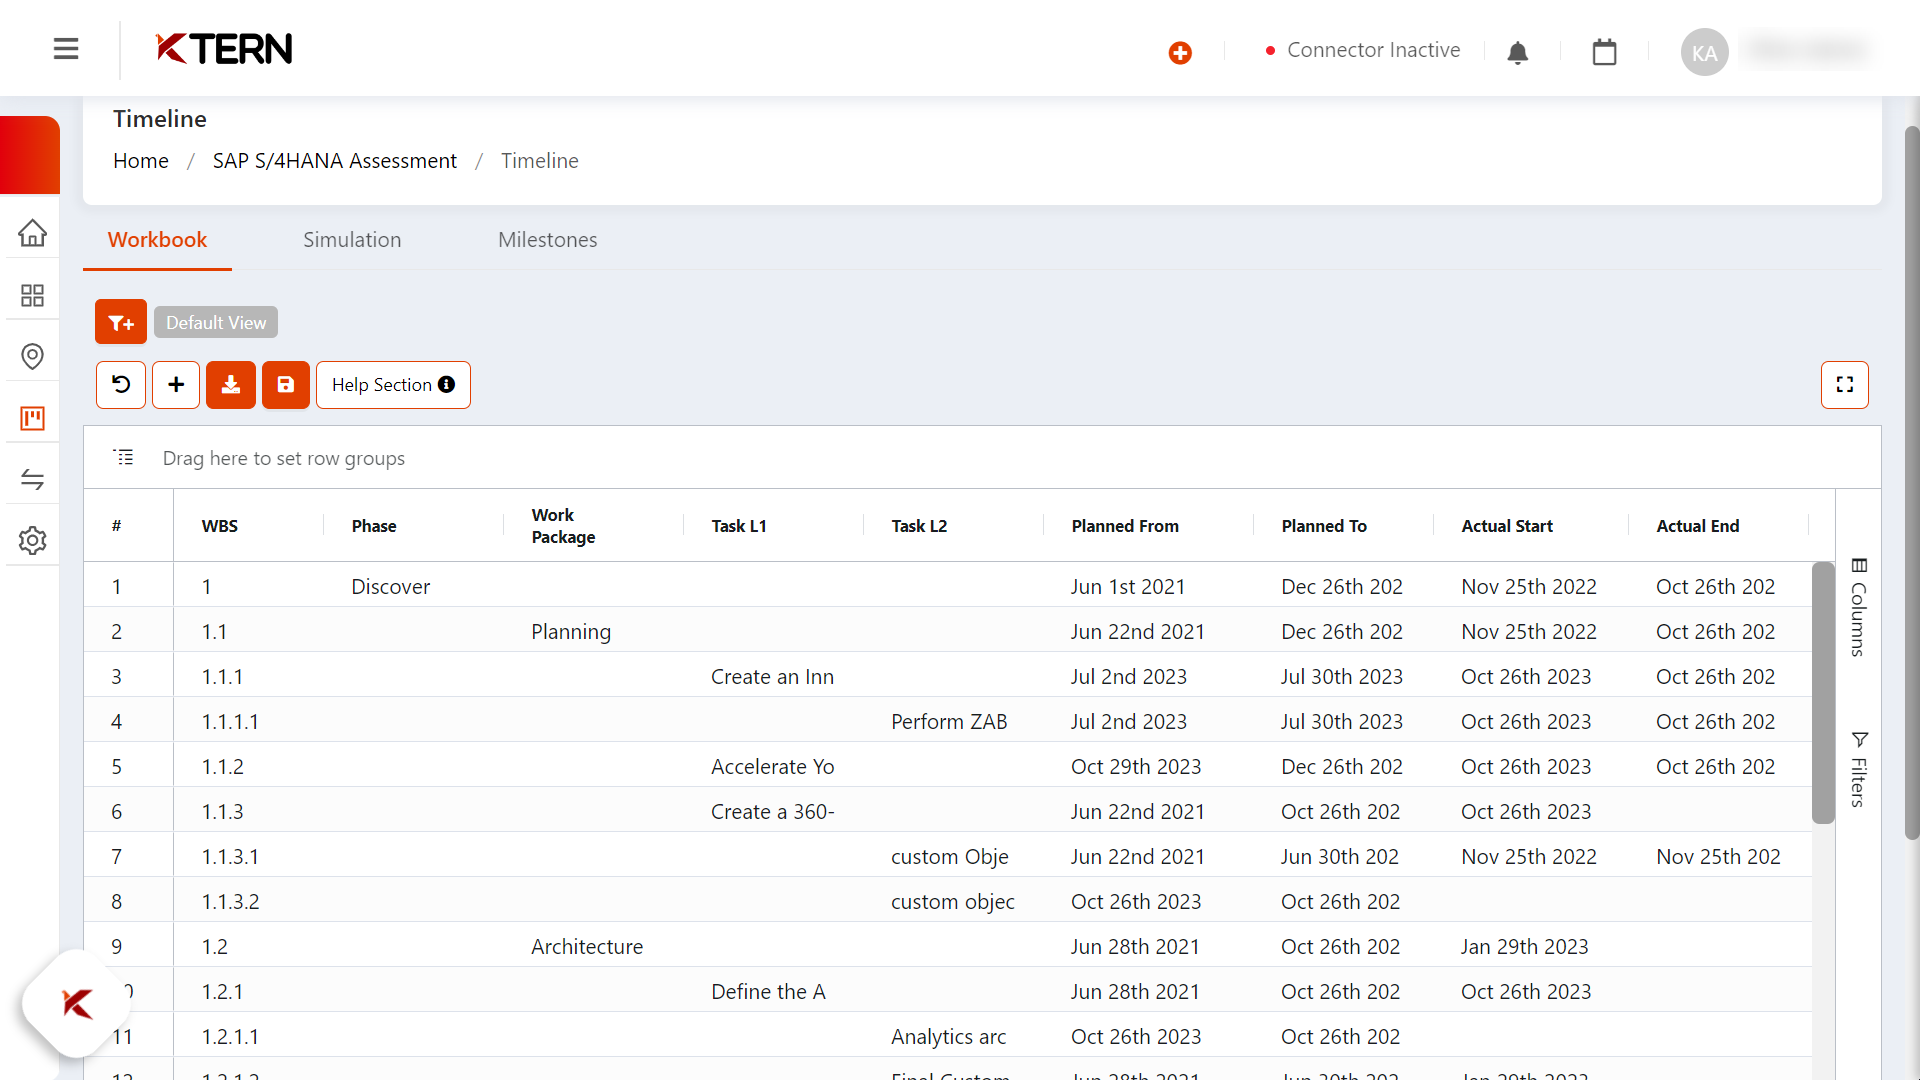
Navigate to Timeline present under Digital Projects, which will showcase the project plan, making it easy for the user to stay updated.
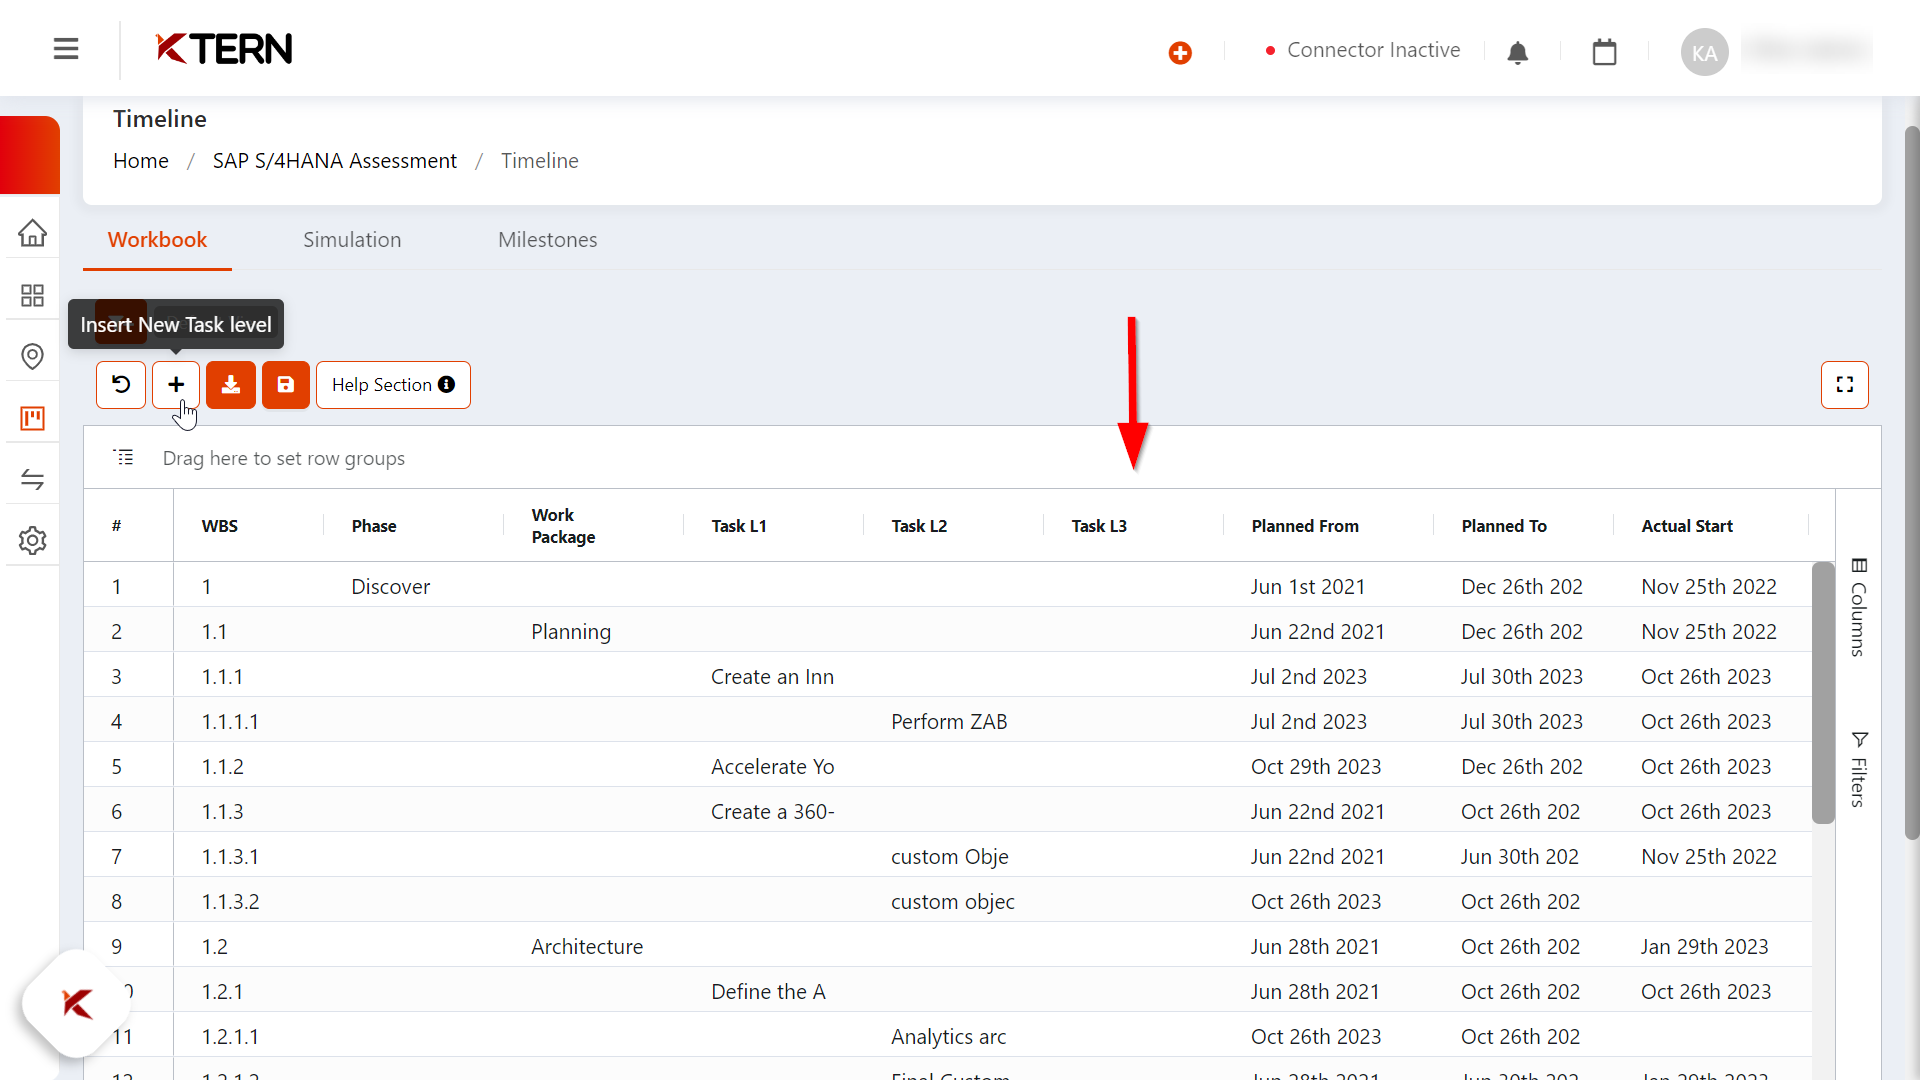
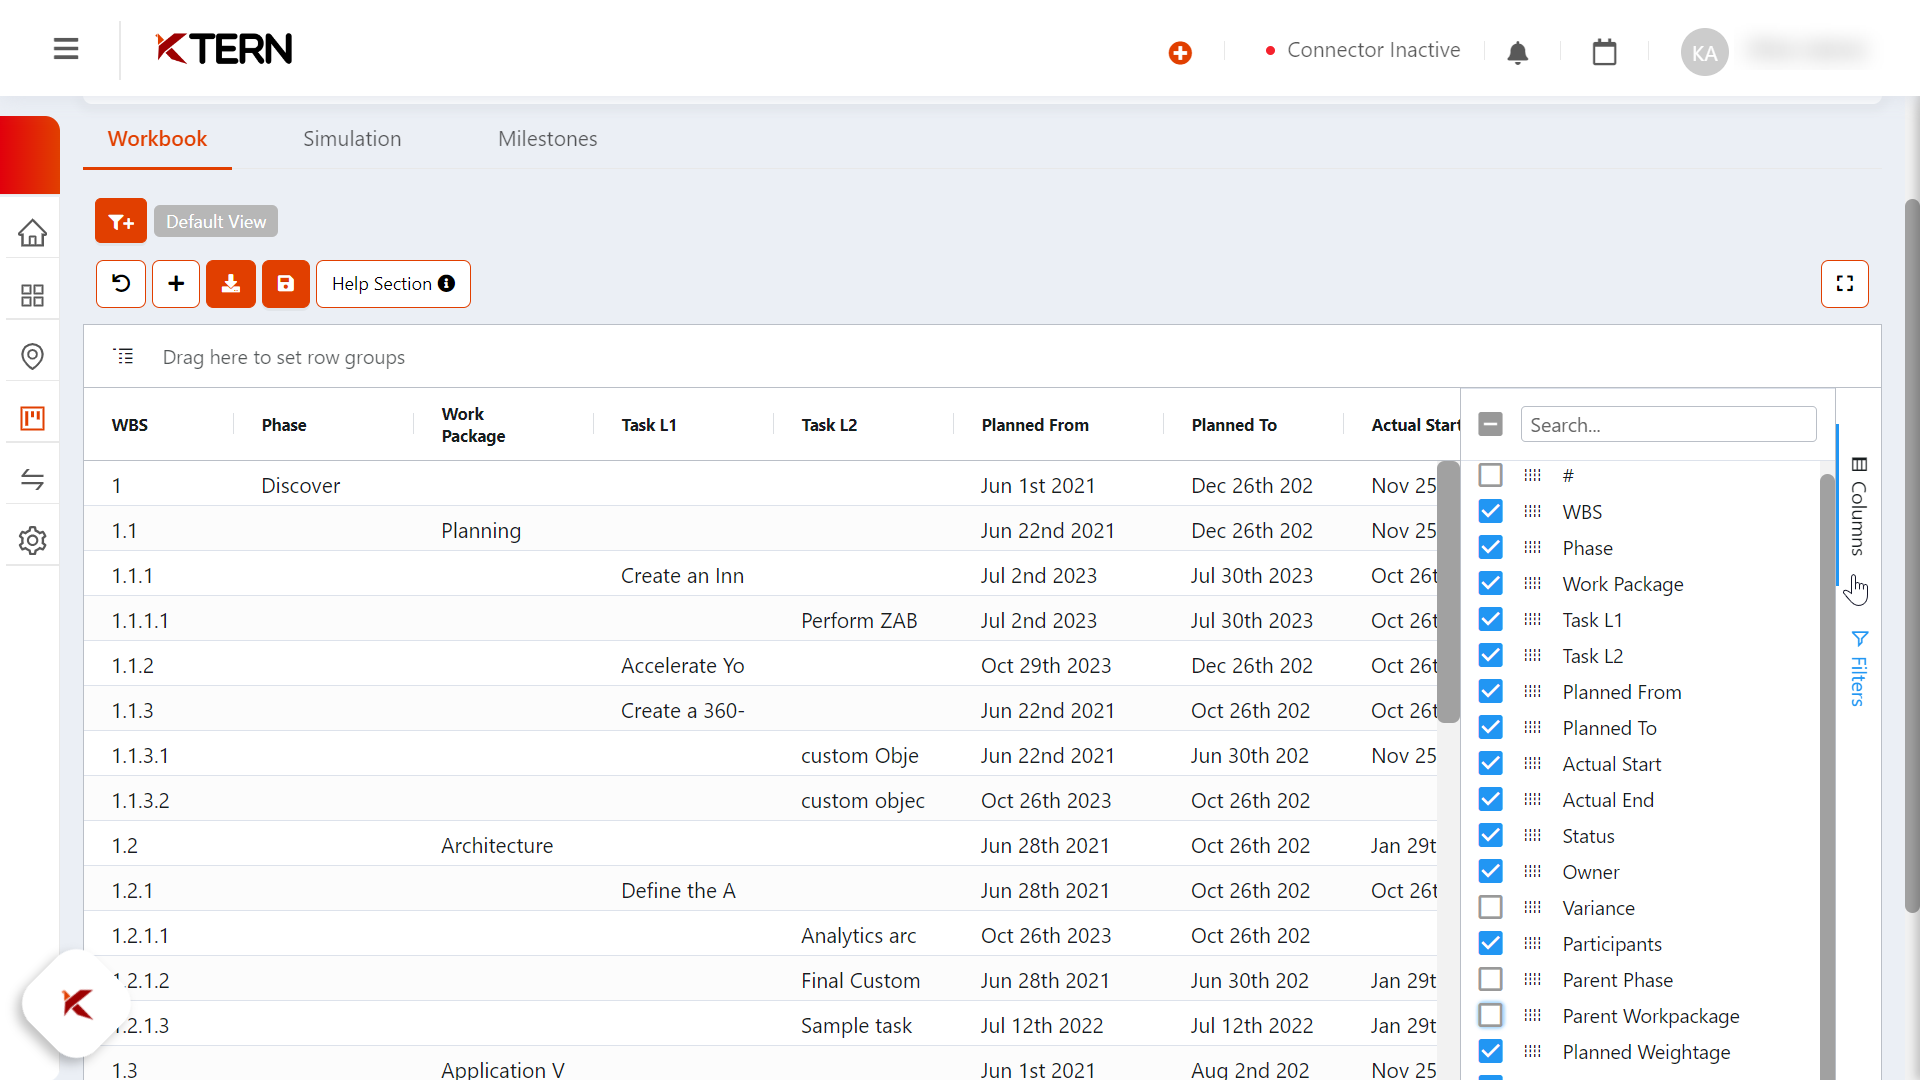
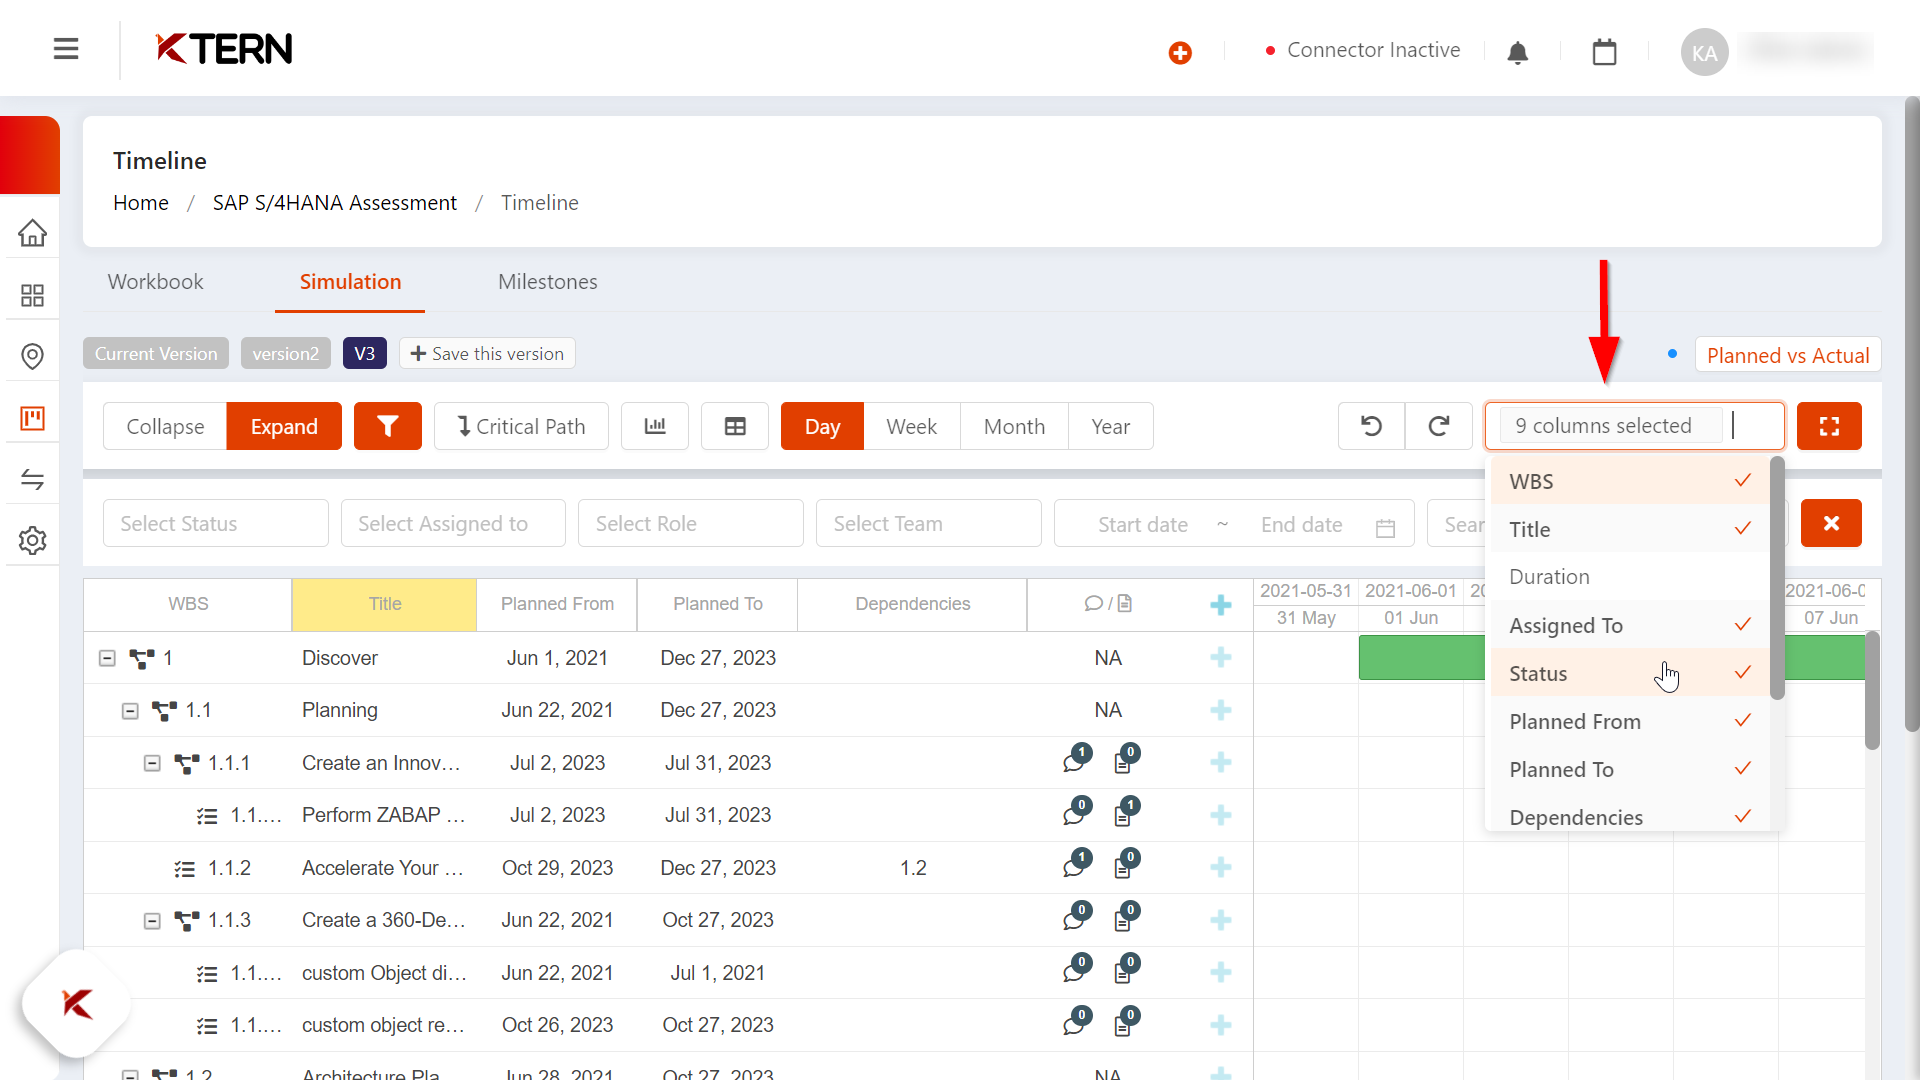
The user has the feasibility to view the table in an enhanced manner where the required columns alone can be selected and viewed, ensuring a streamlined experience.
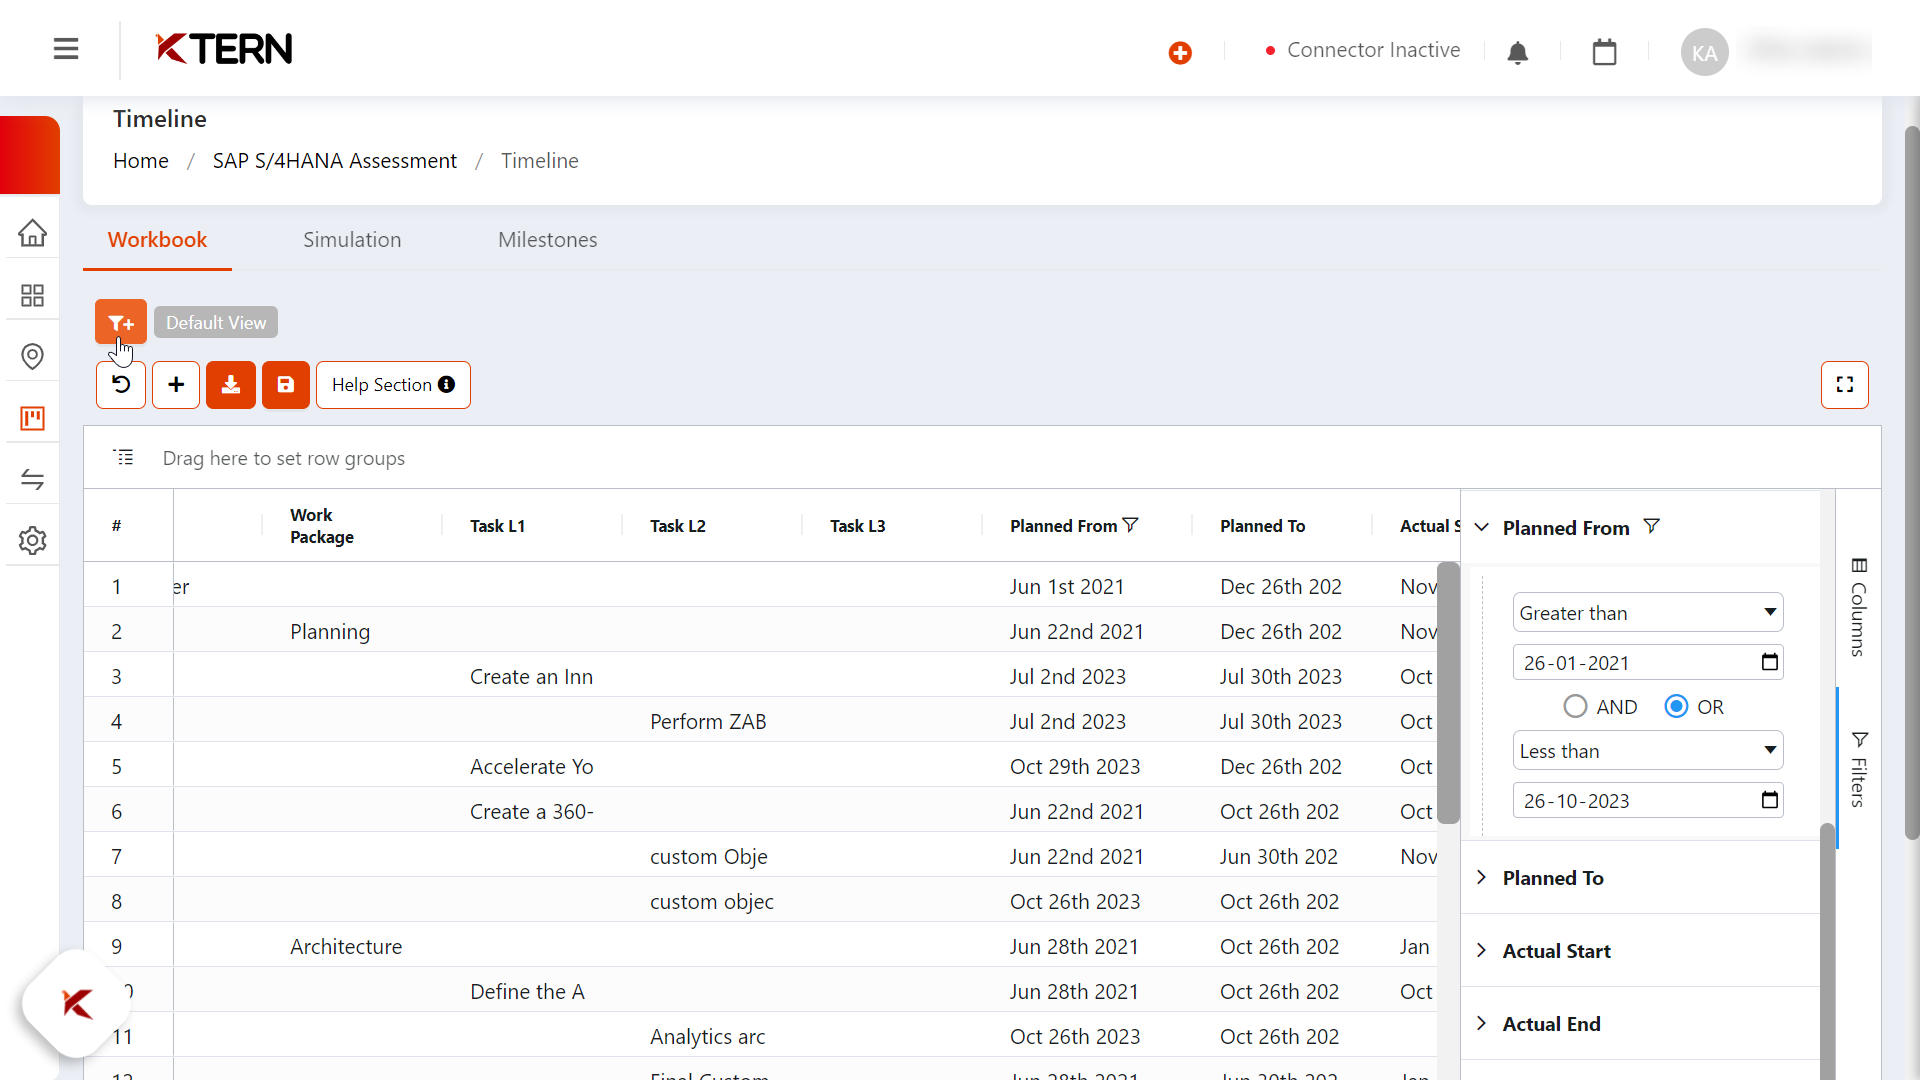
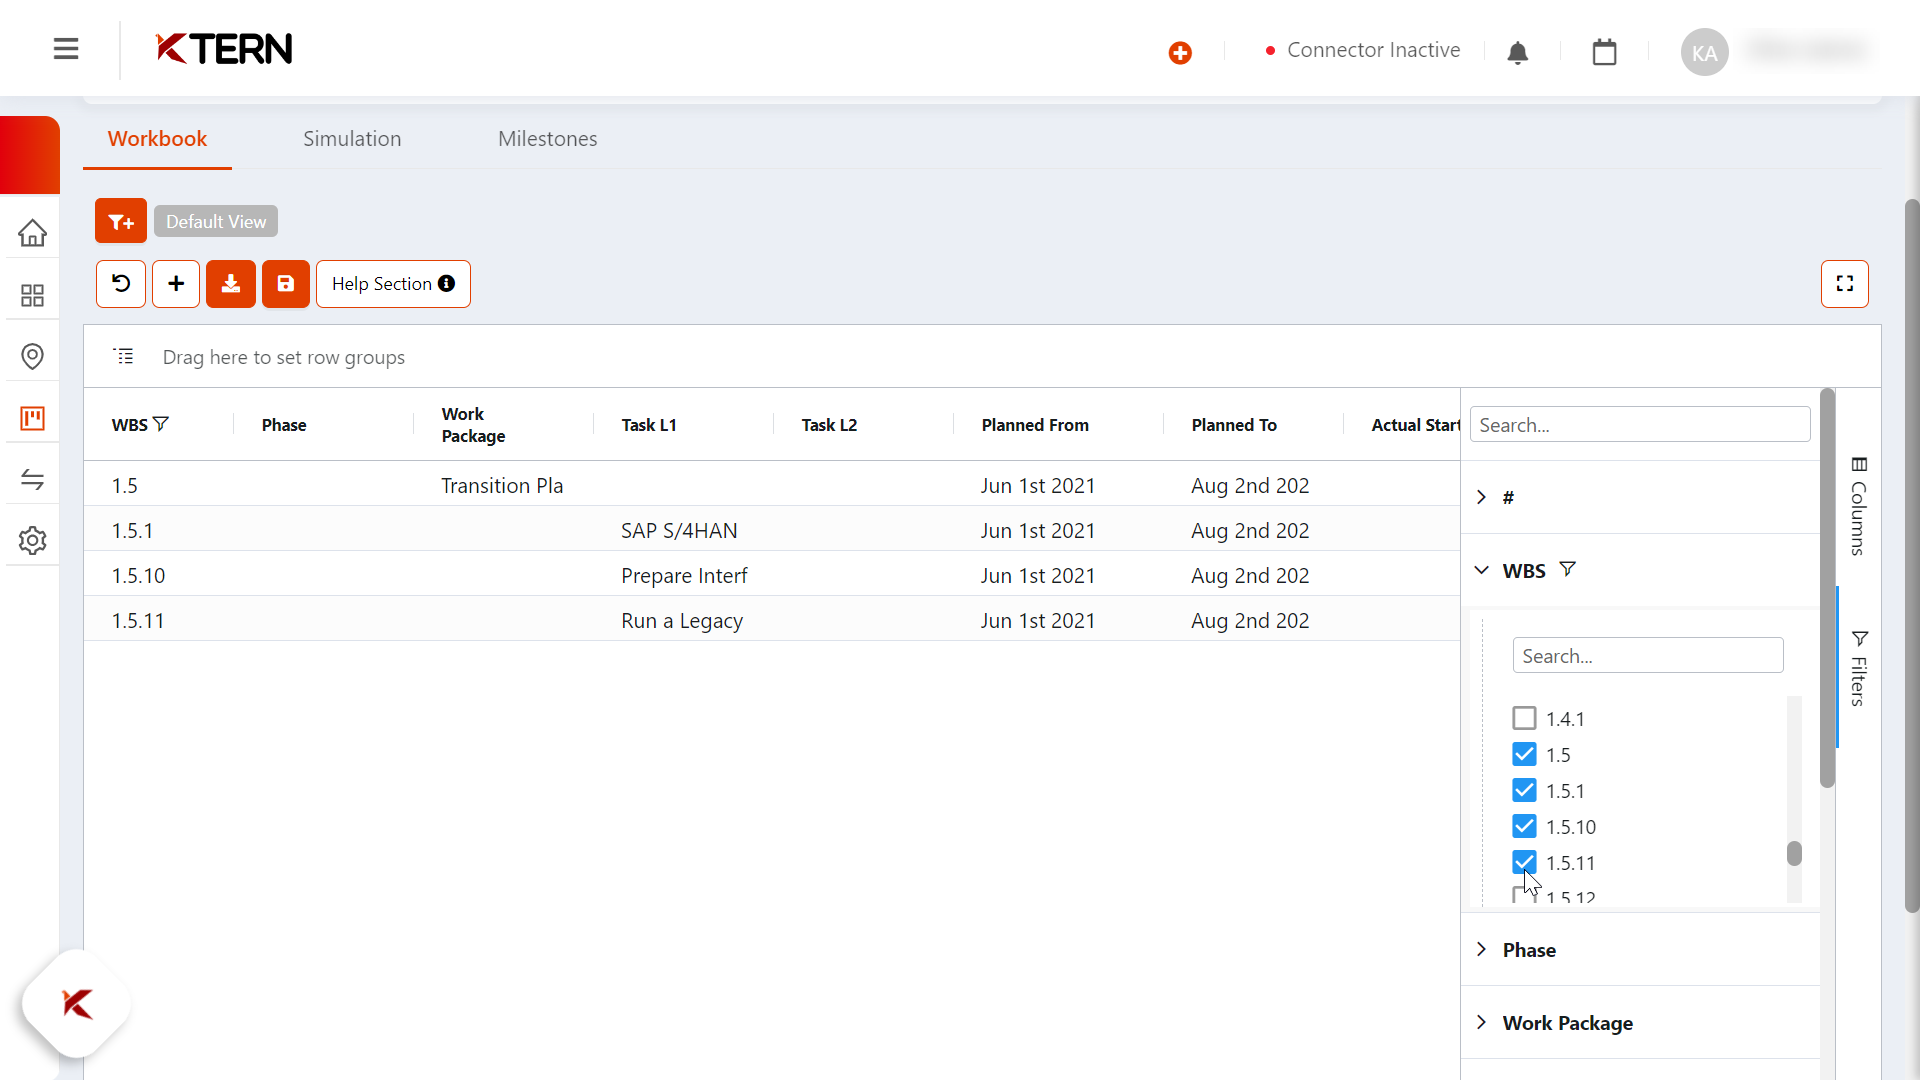
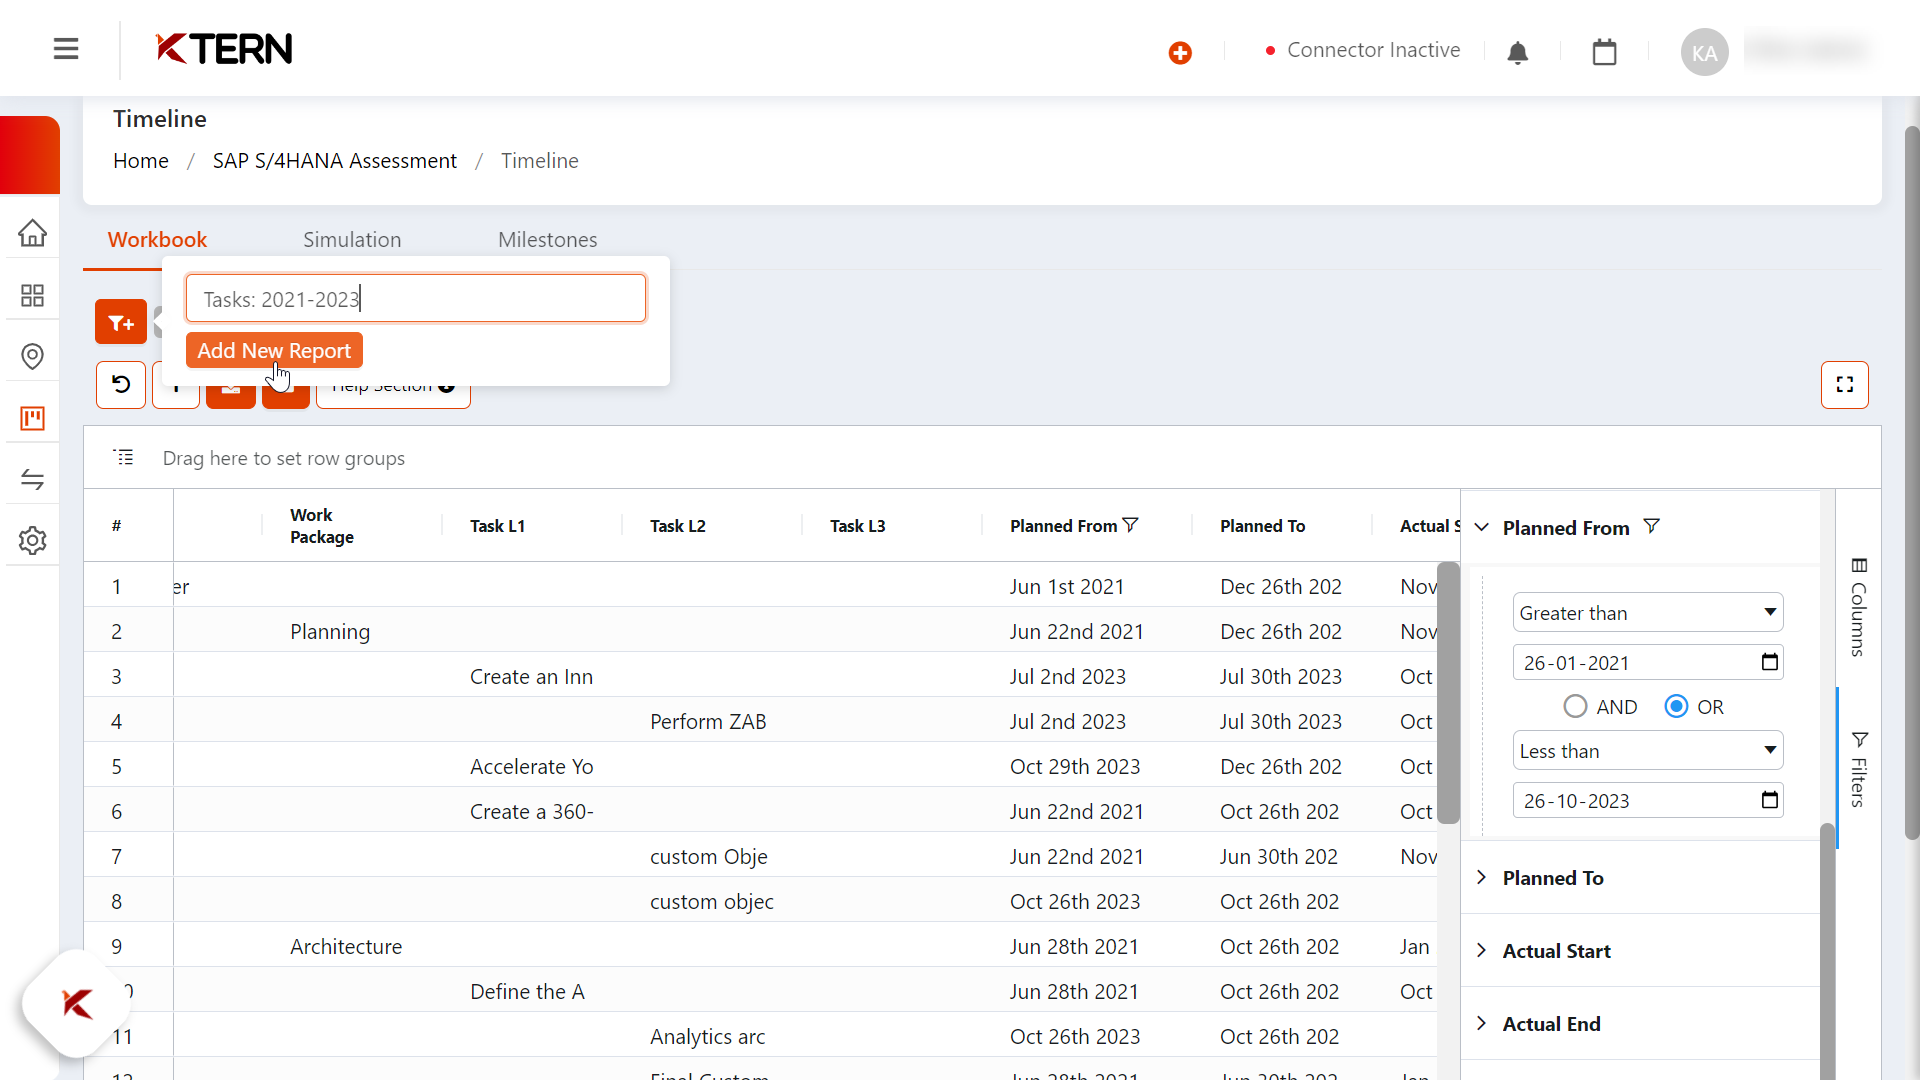
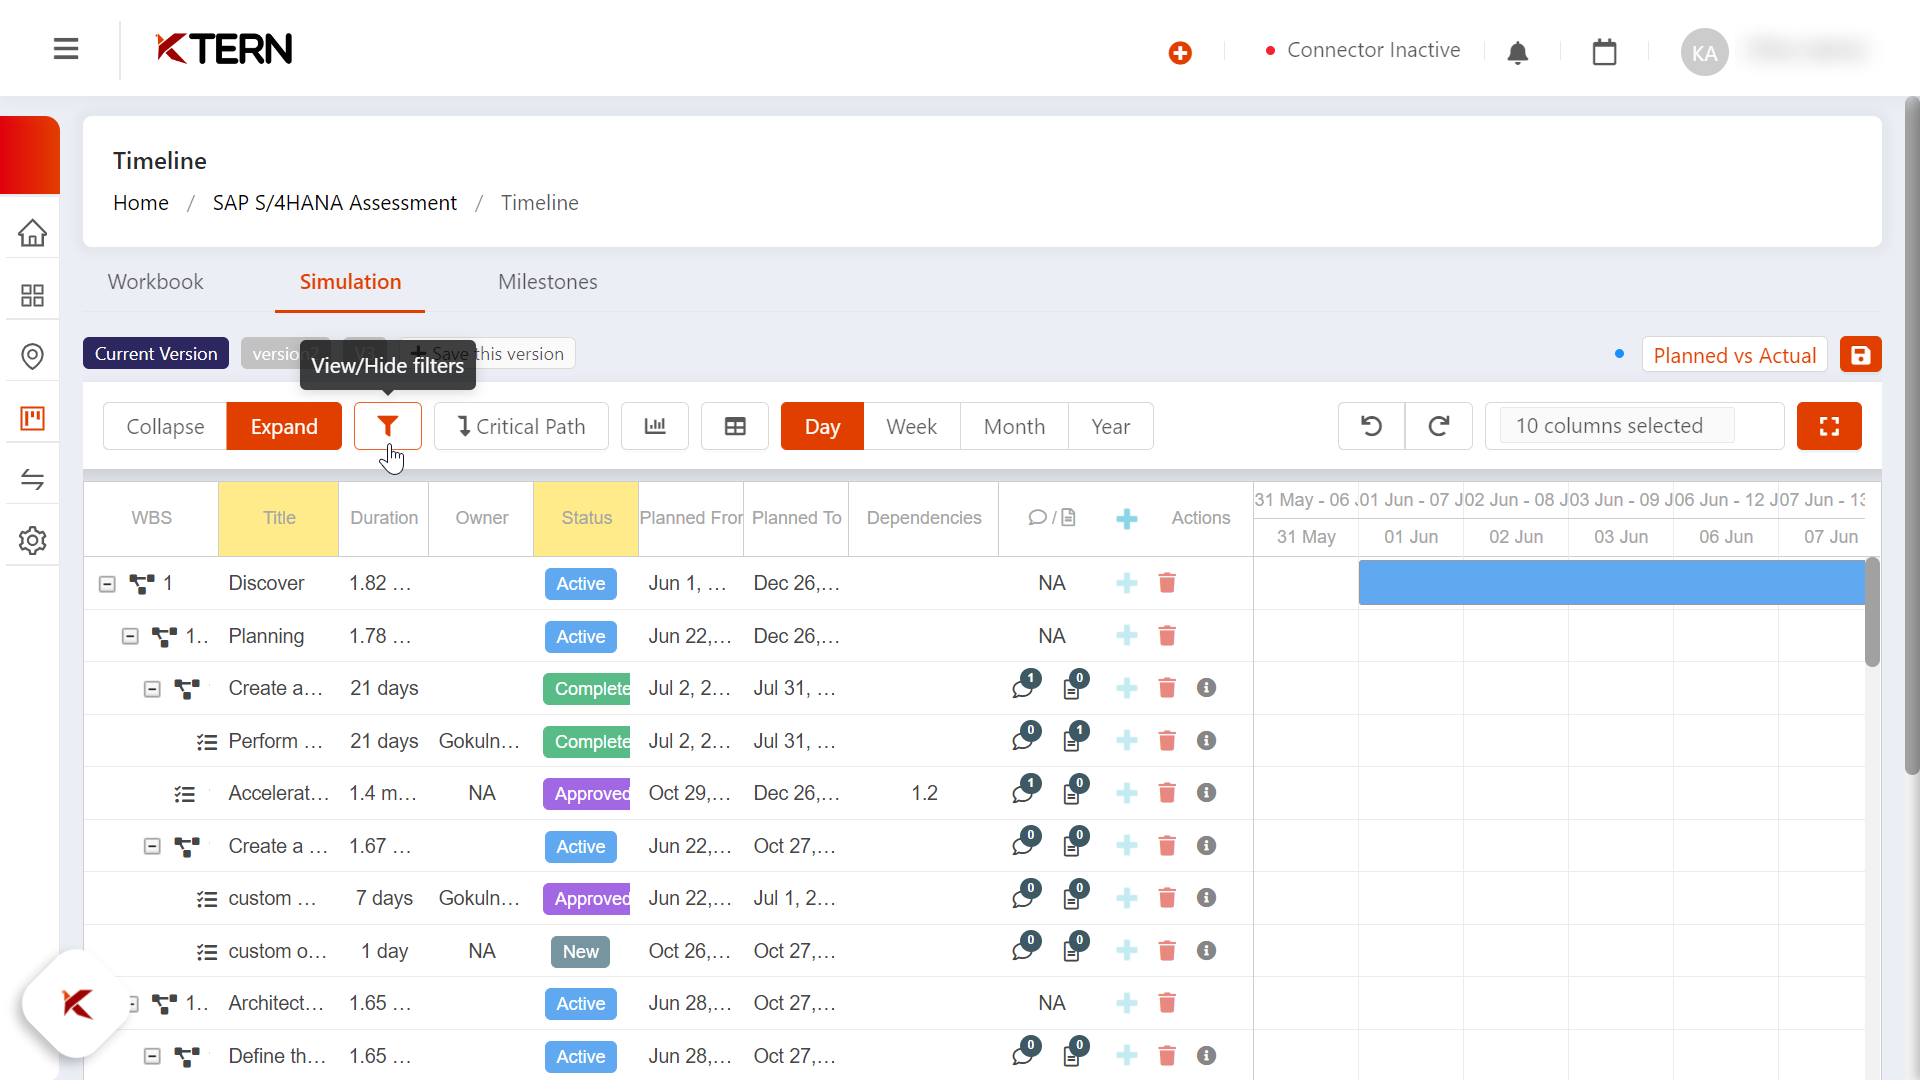
As per the requirement, different filters can be applied as shown, and the data can be drilled down as per the need, enabling the user to focus on what's important.
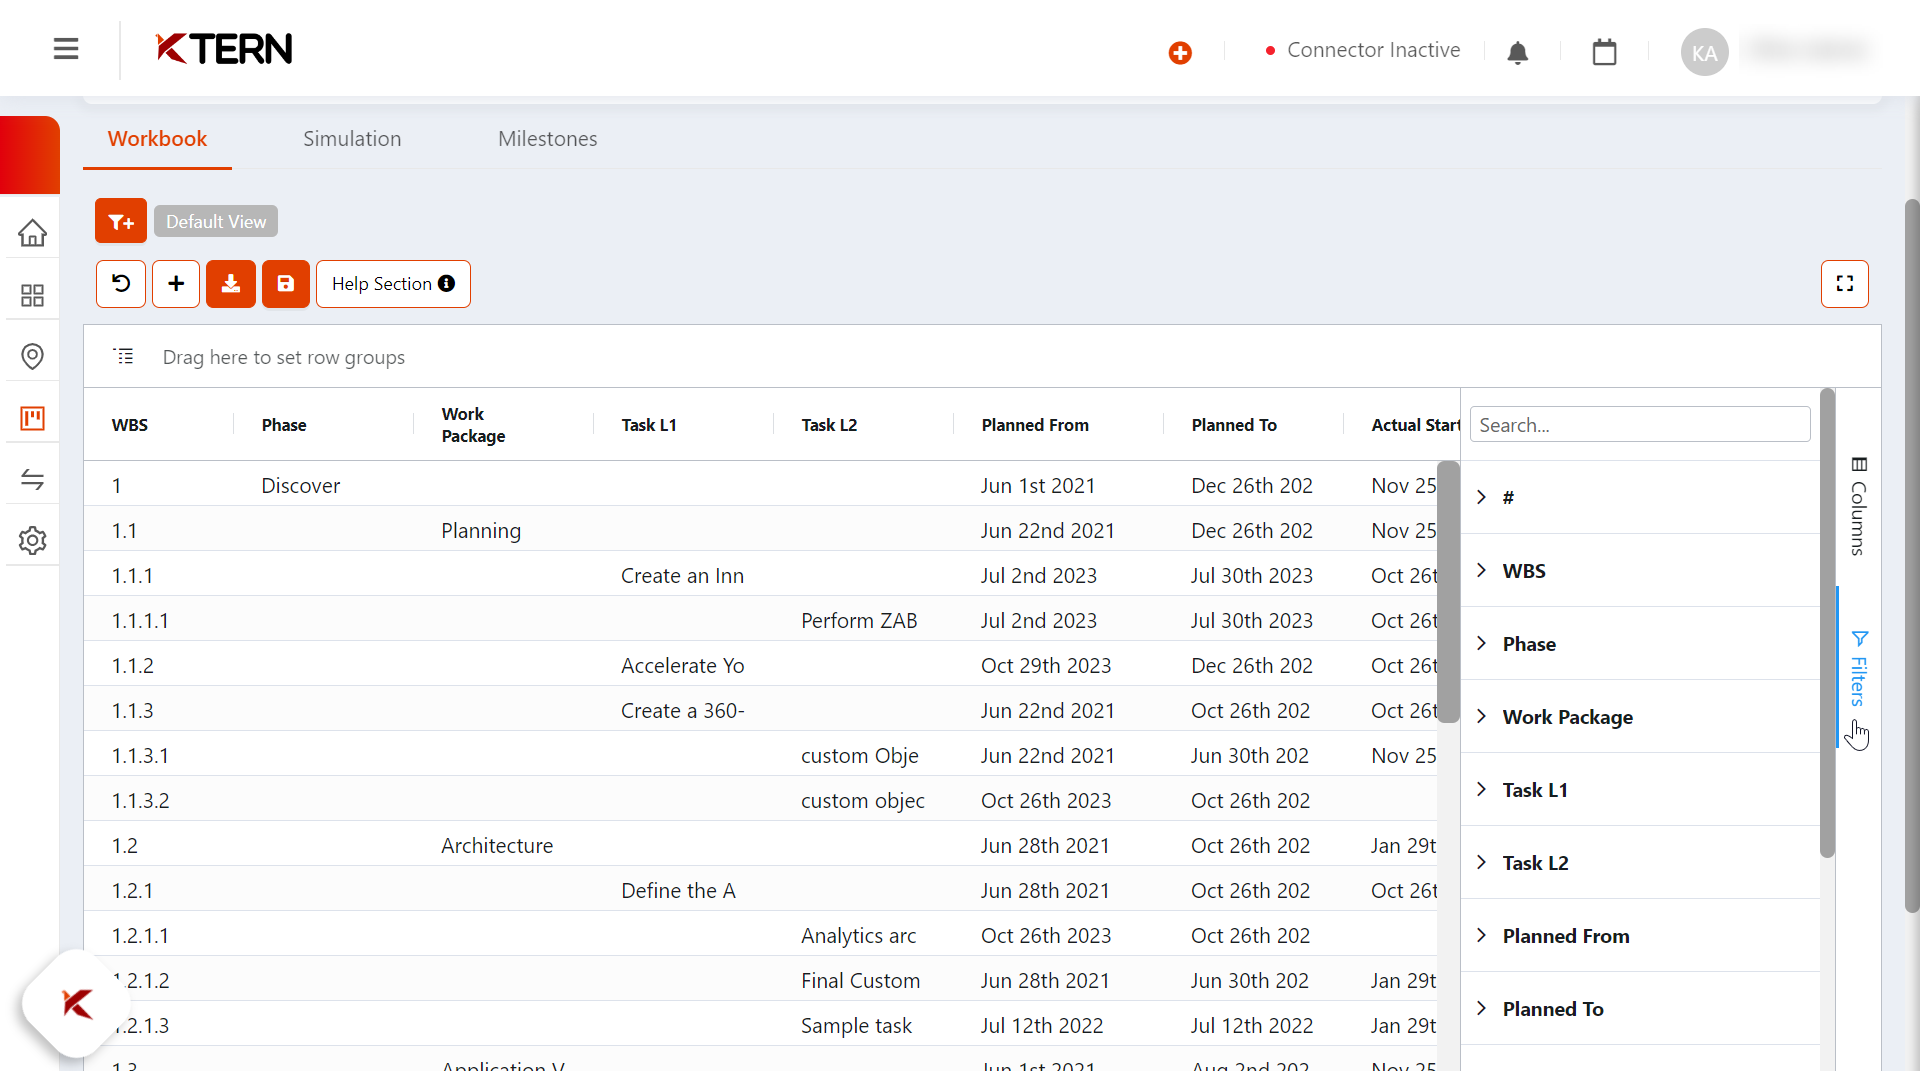
For example, here, the project plan is drilled down by WBS, enhancing the user's ability to access specific information.
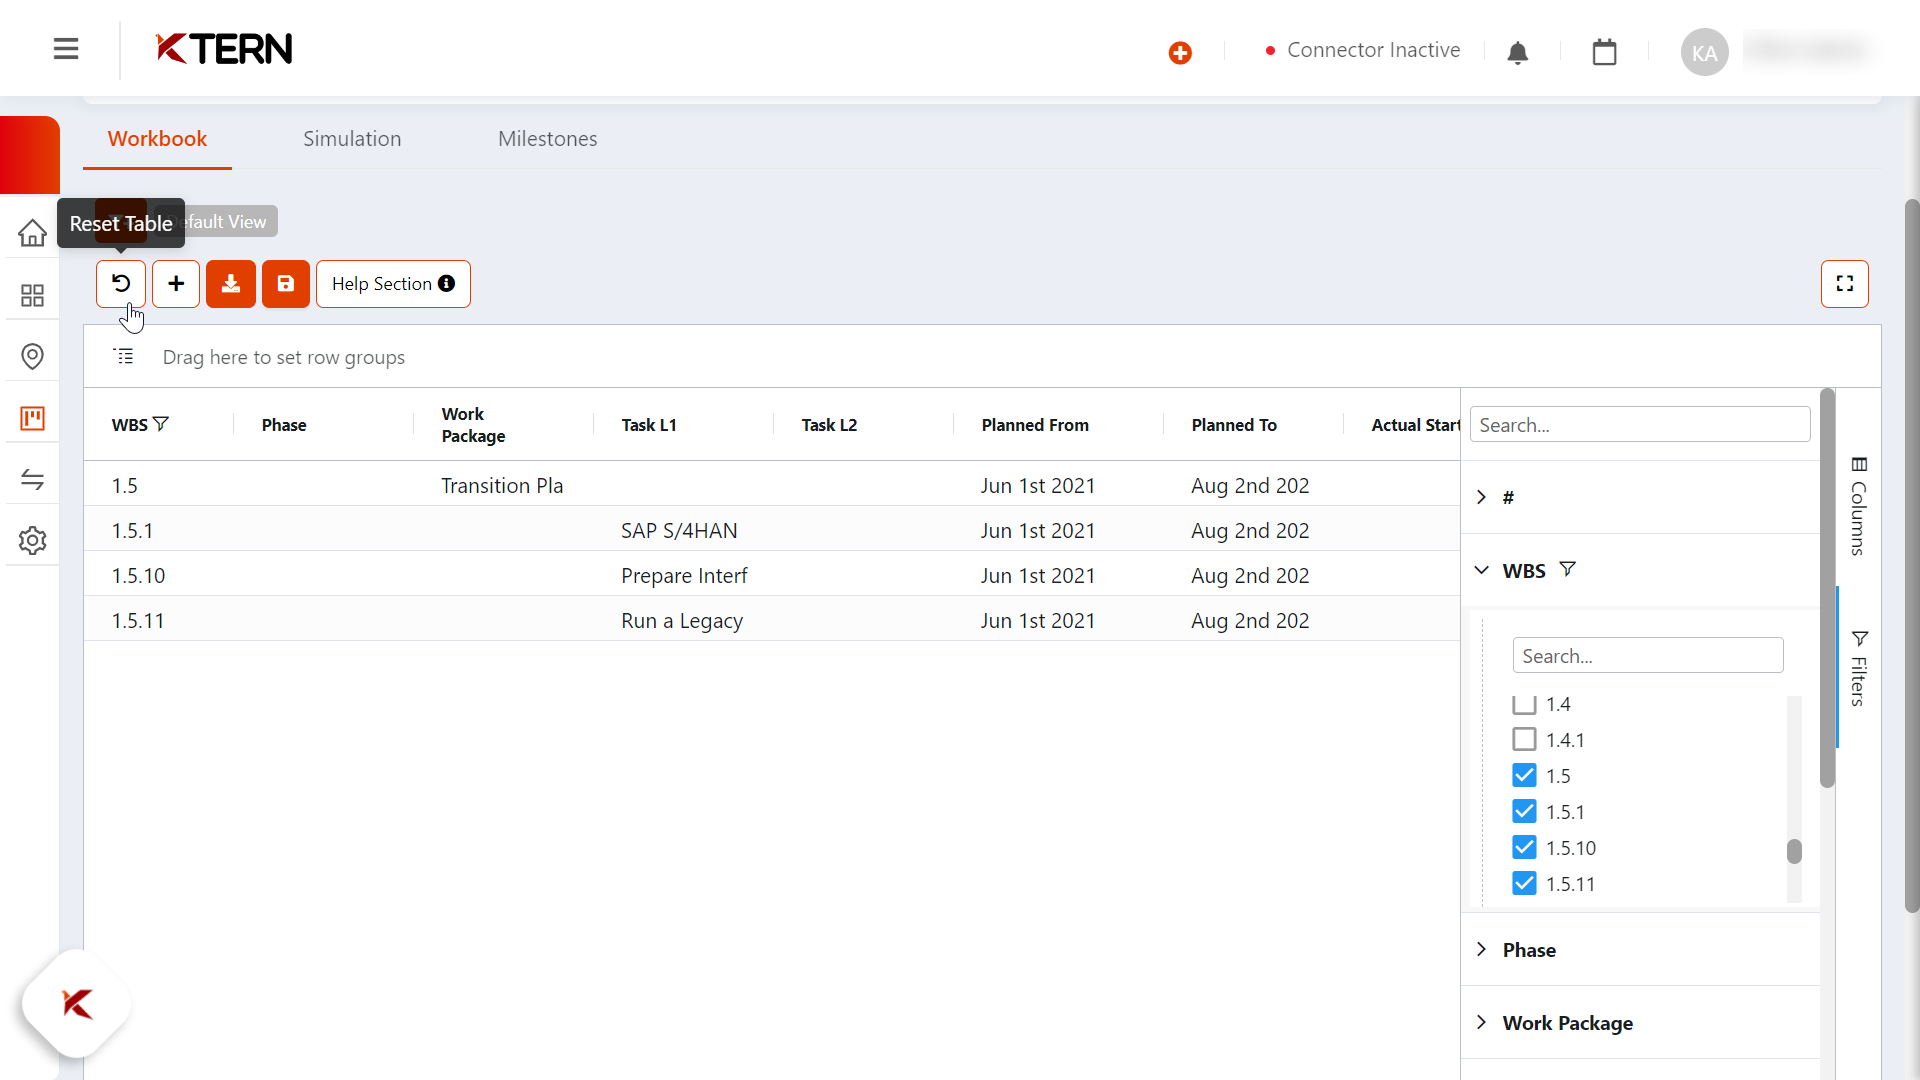
If you want to remove all the filters, there's no necessity for the user to go and remove everything one by one. The user could just click the "Reset Table" icon, upon which the whole plan will be shown, saving valuable time.
There's no limitation for having the task levels. Click the "+" icon to insert new task levels, giving the user flexibility in project structuring.
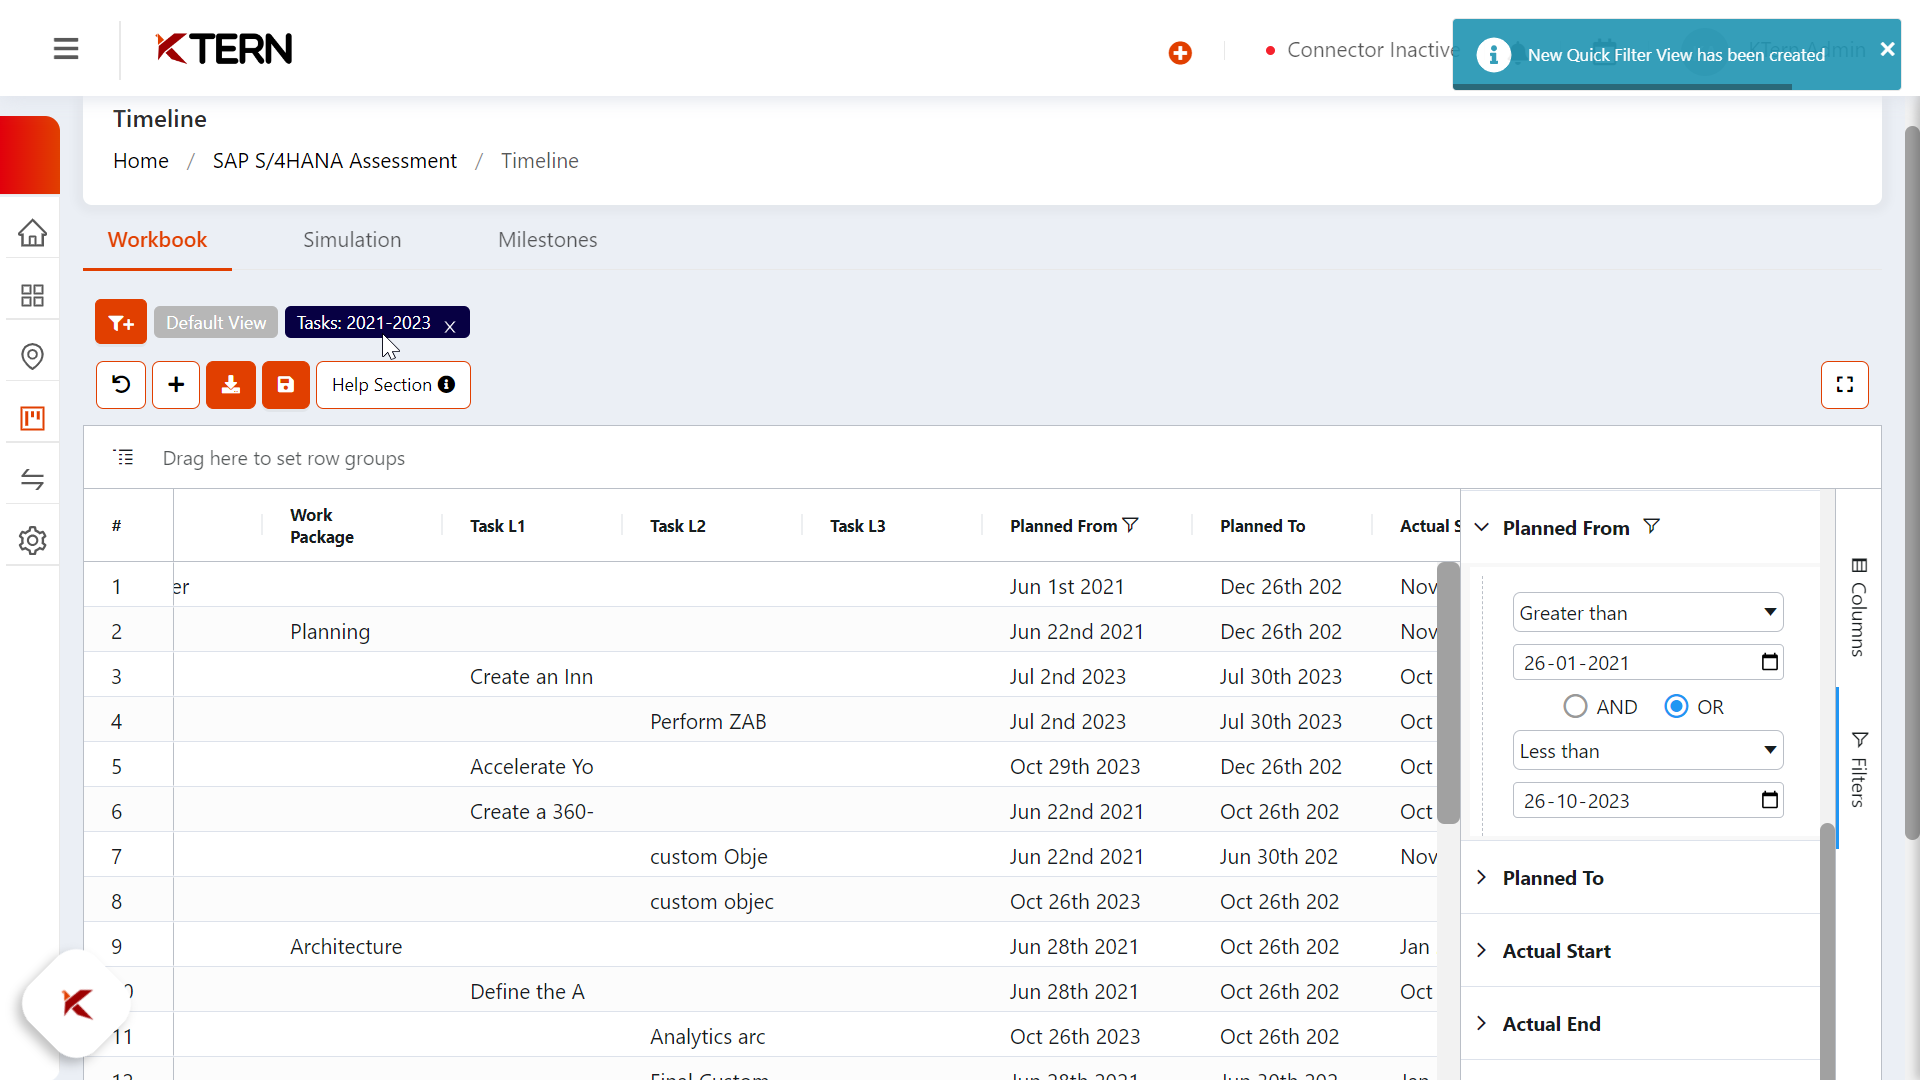
Based on various filters applied, the user can create a report of their own as shown in the below image and use it for their reference, making data analysis effortless.
Thus, here's the sample report named "Tasks 2021 - 2023" for the user's convenience.
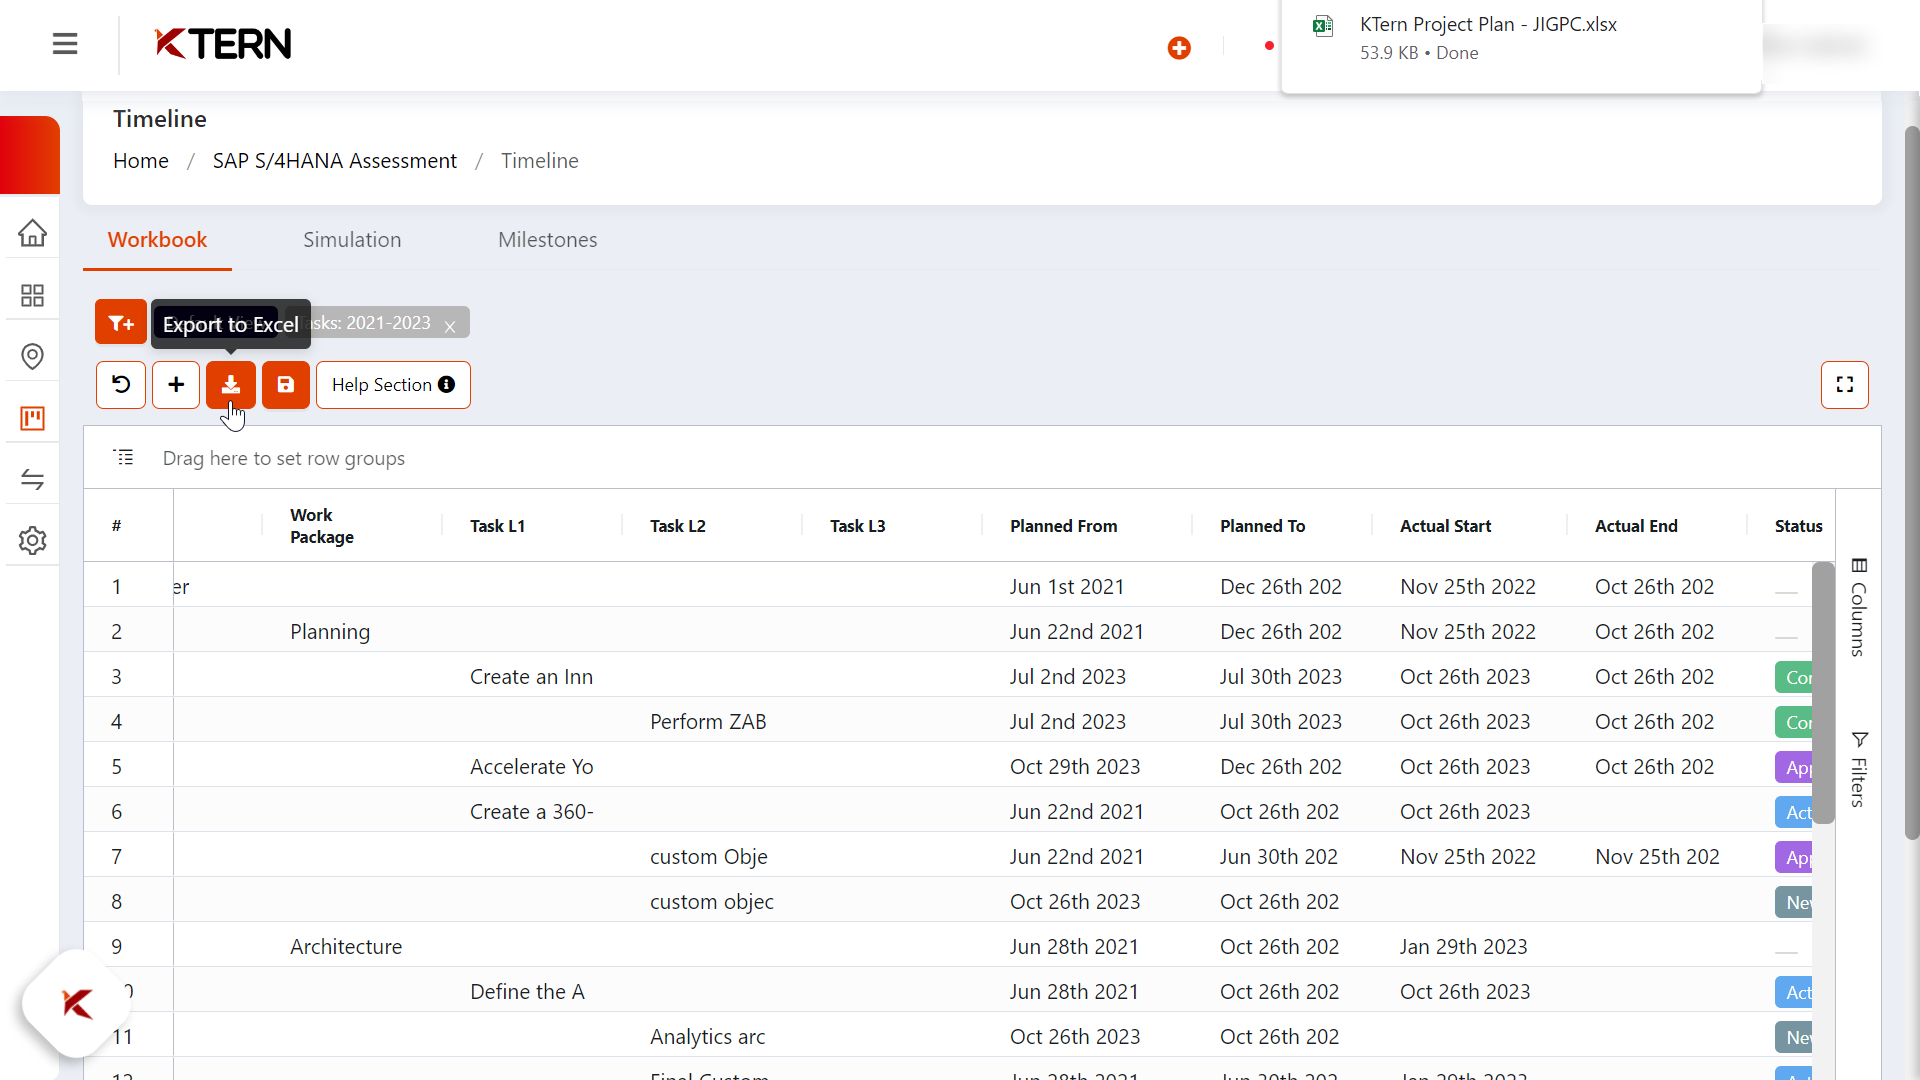
For sending the plan to someone out of the project, the user can export the excel by clicking the download icon, ensuring seamless sharing.
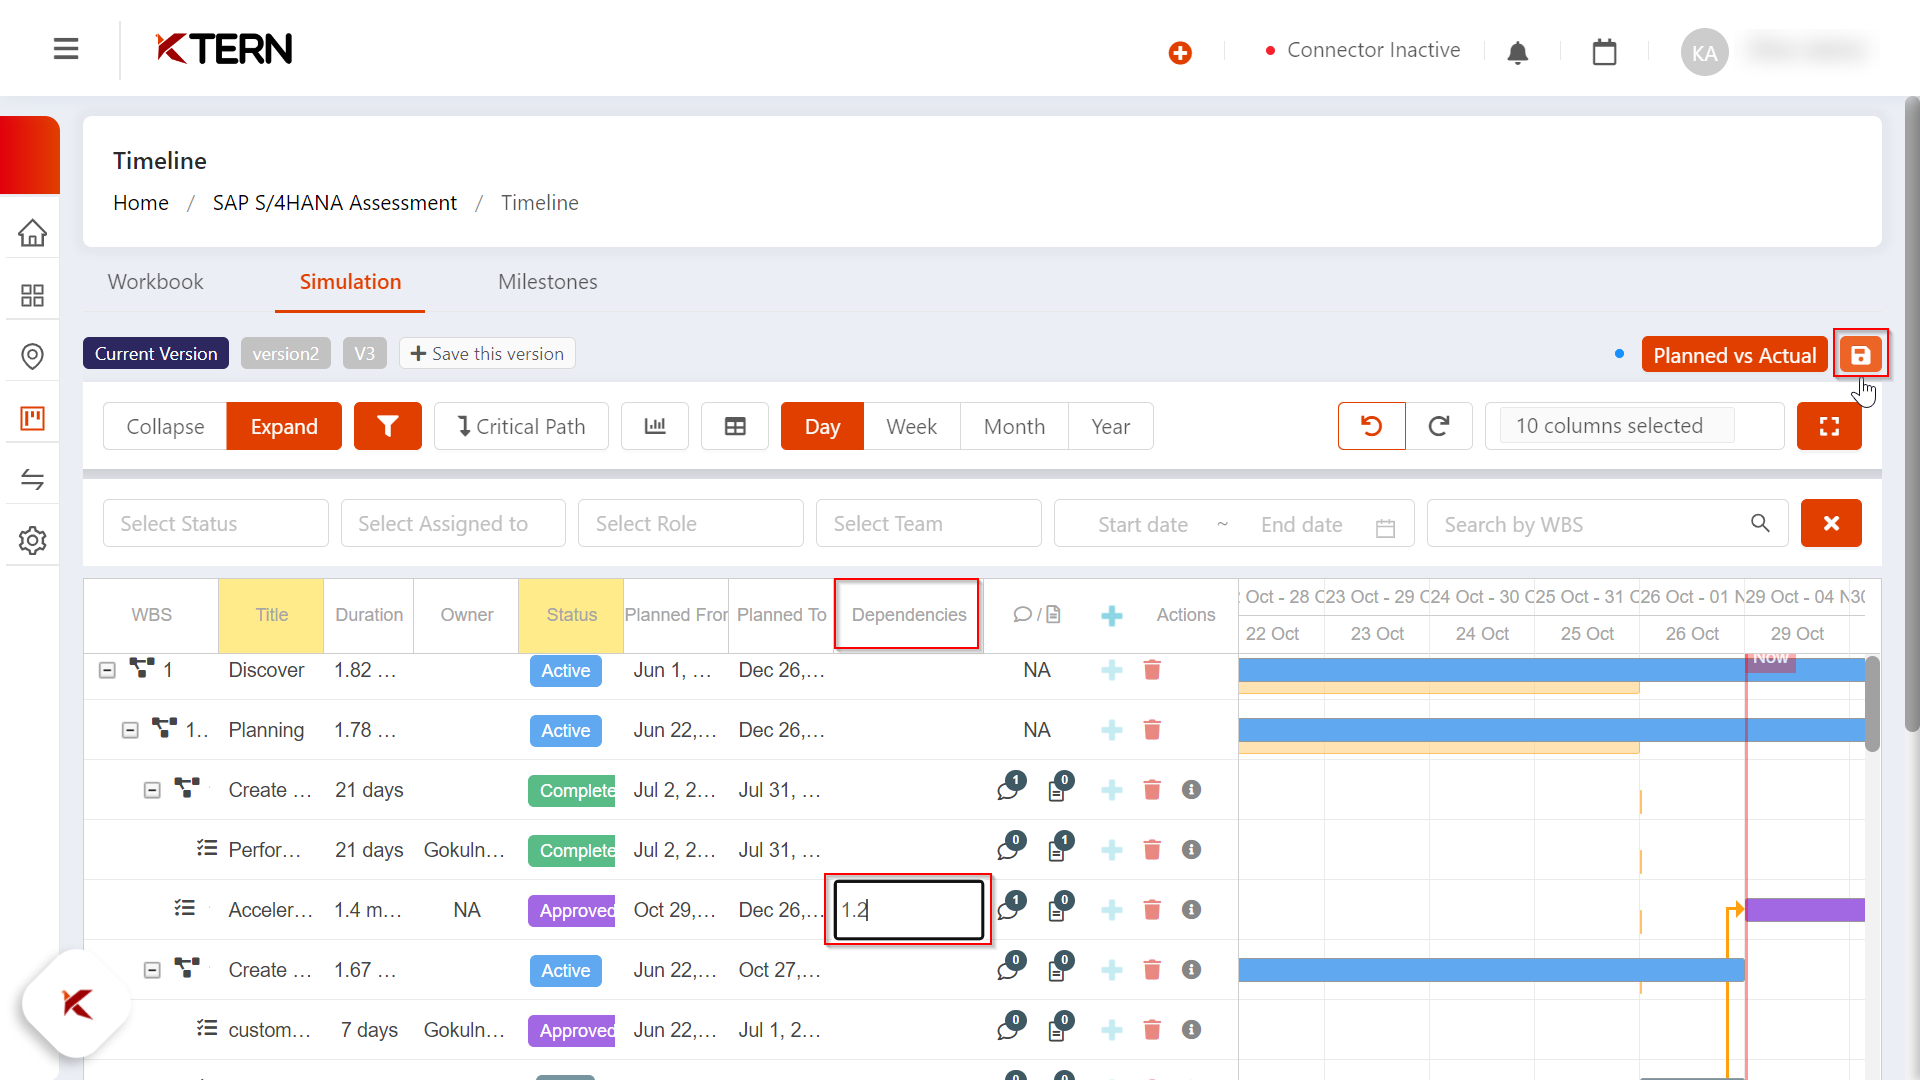
If any changes have been made in the plan, it should be saved by triggering the save button, ensuring data integrity.
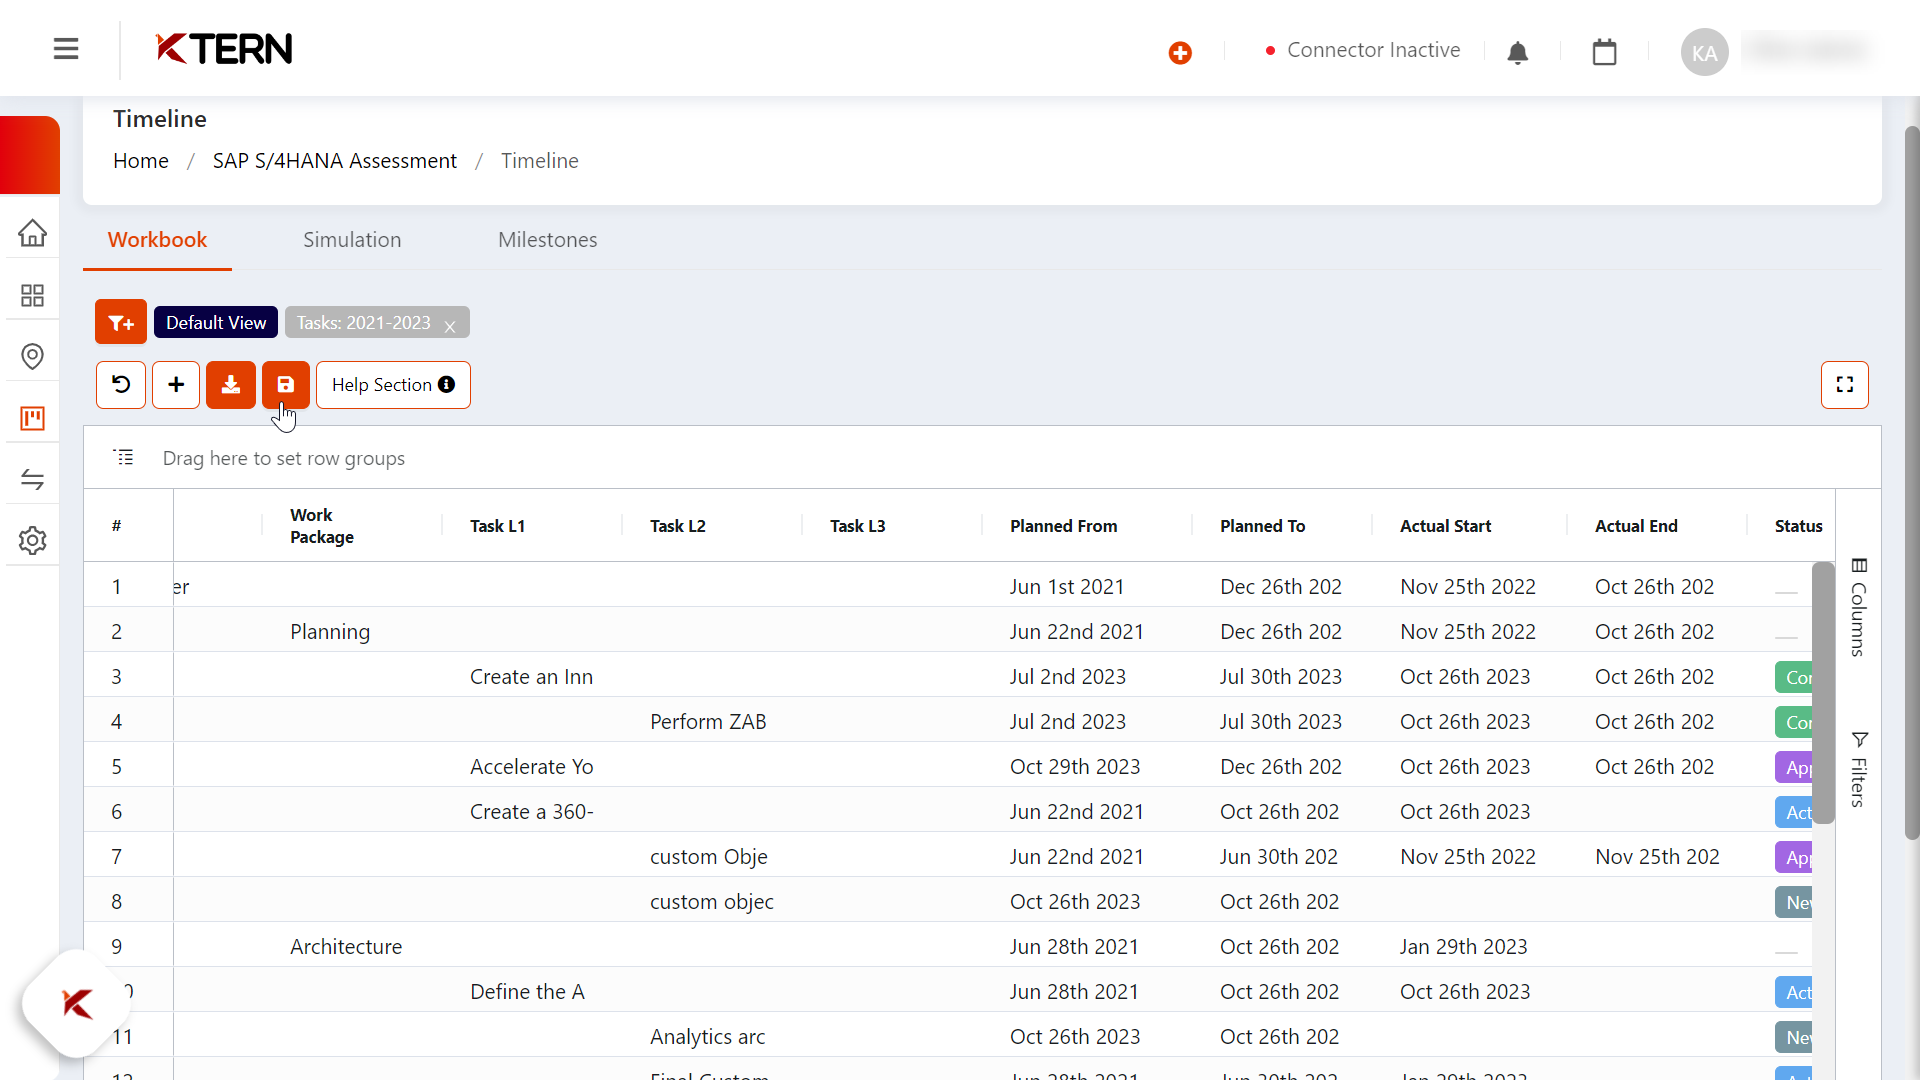
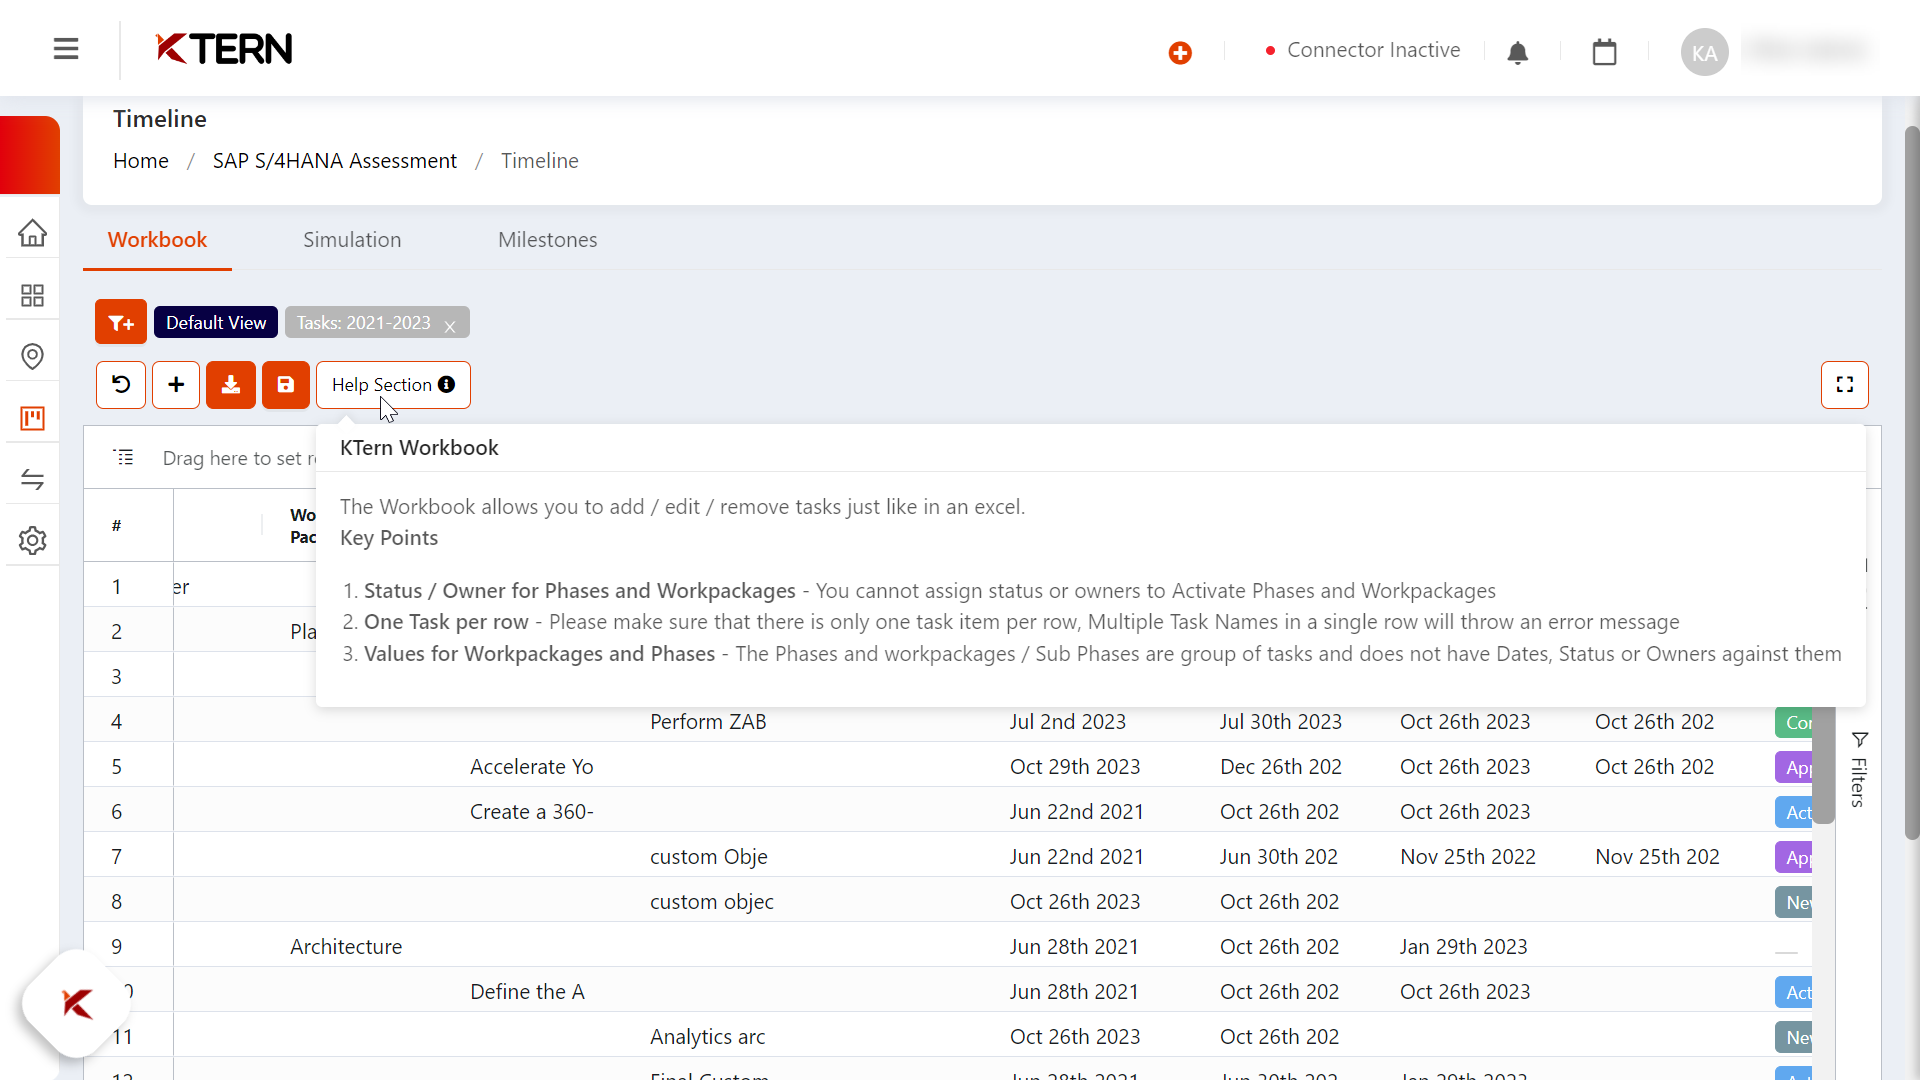
If any support is needed, click on the "Help Section" to access assistance.
Simulation
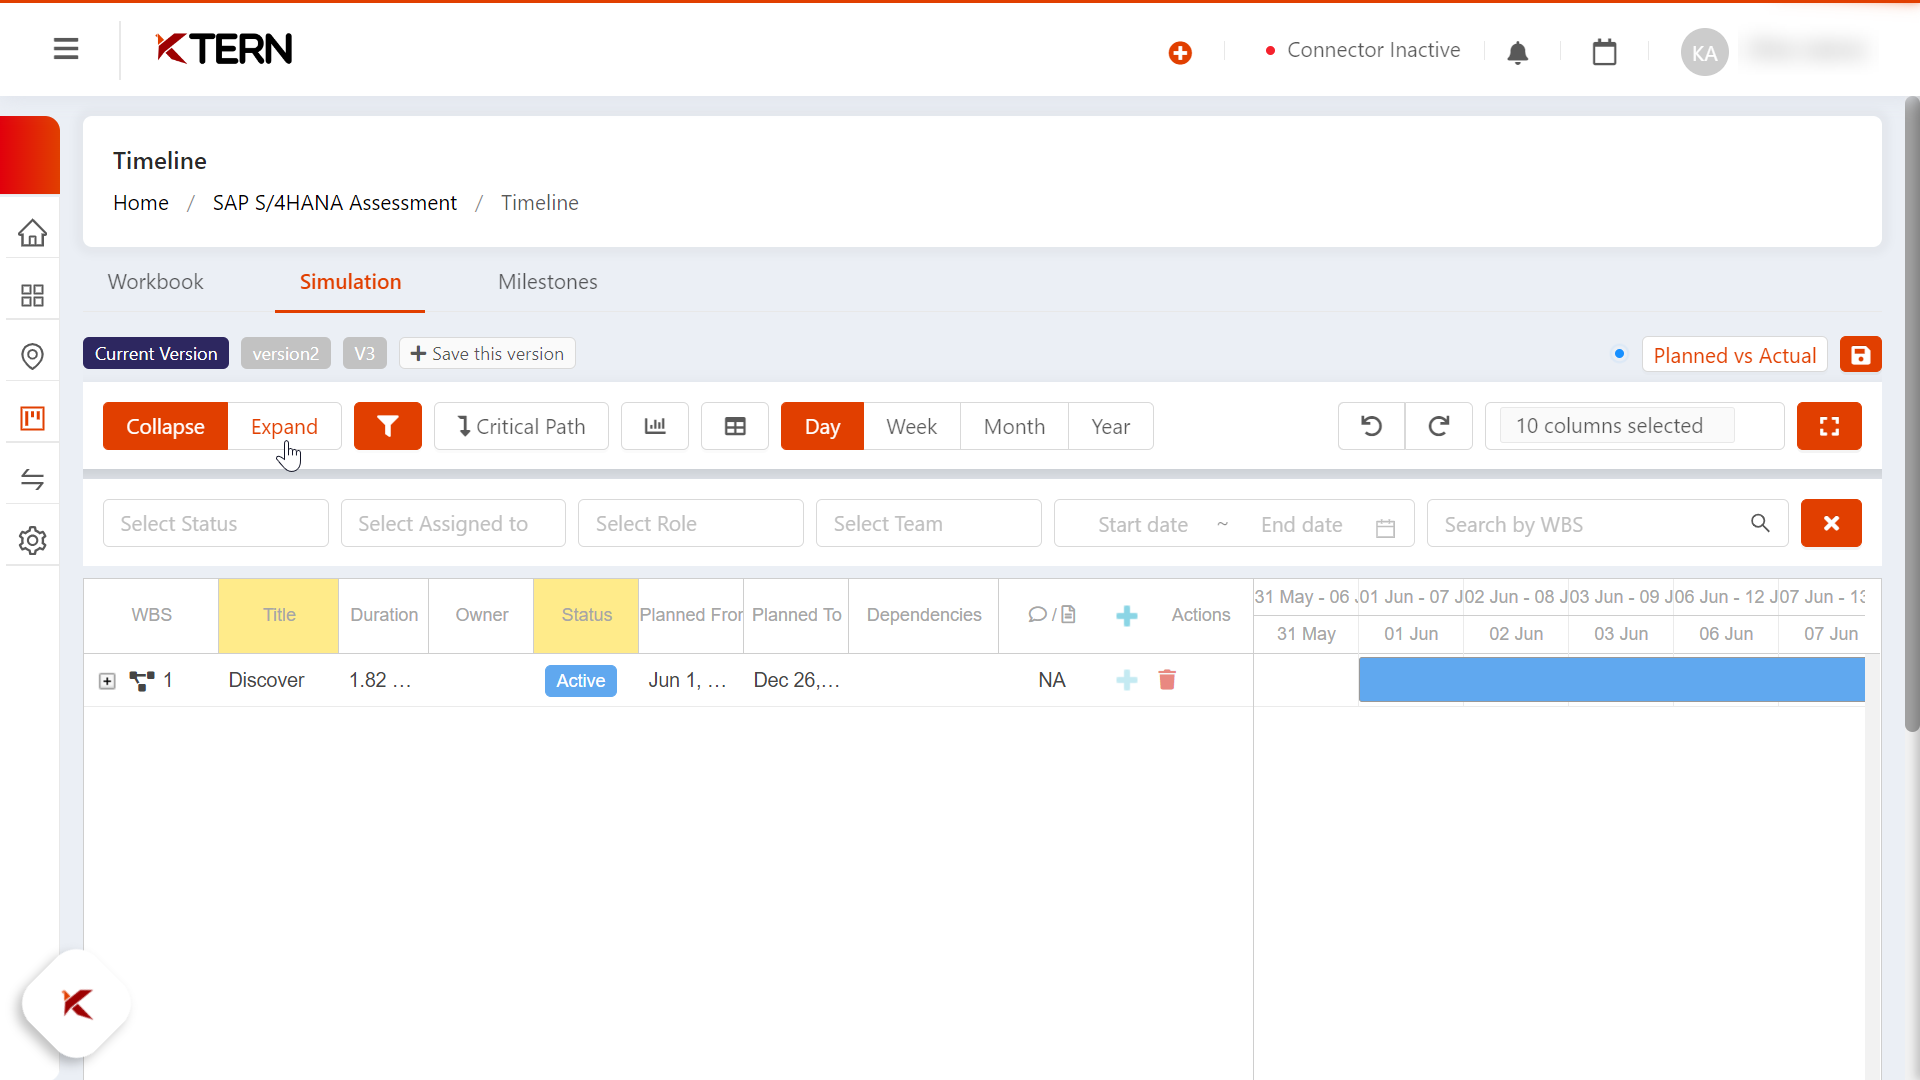
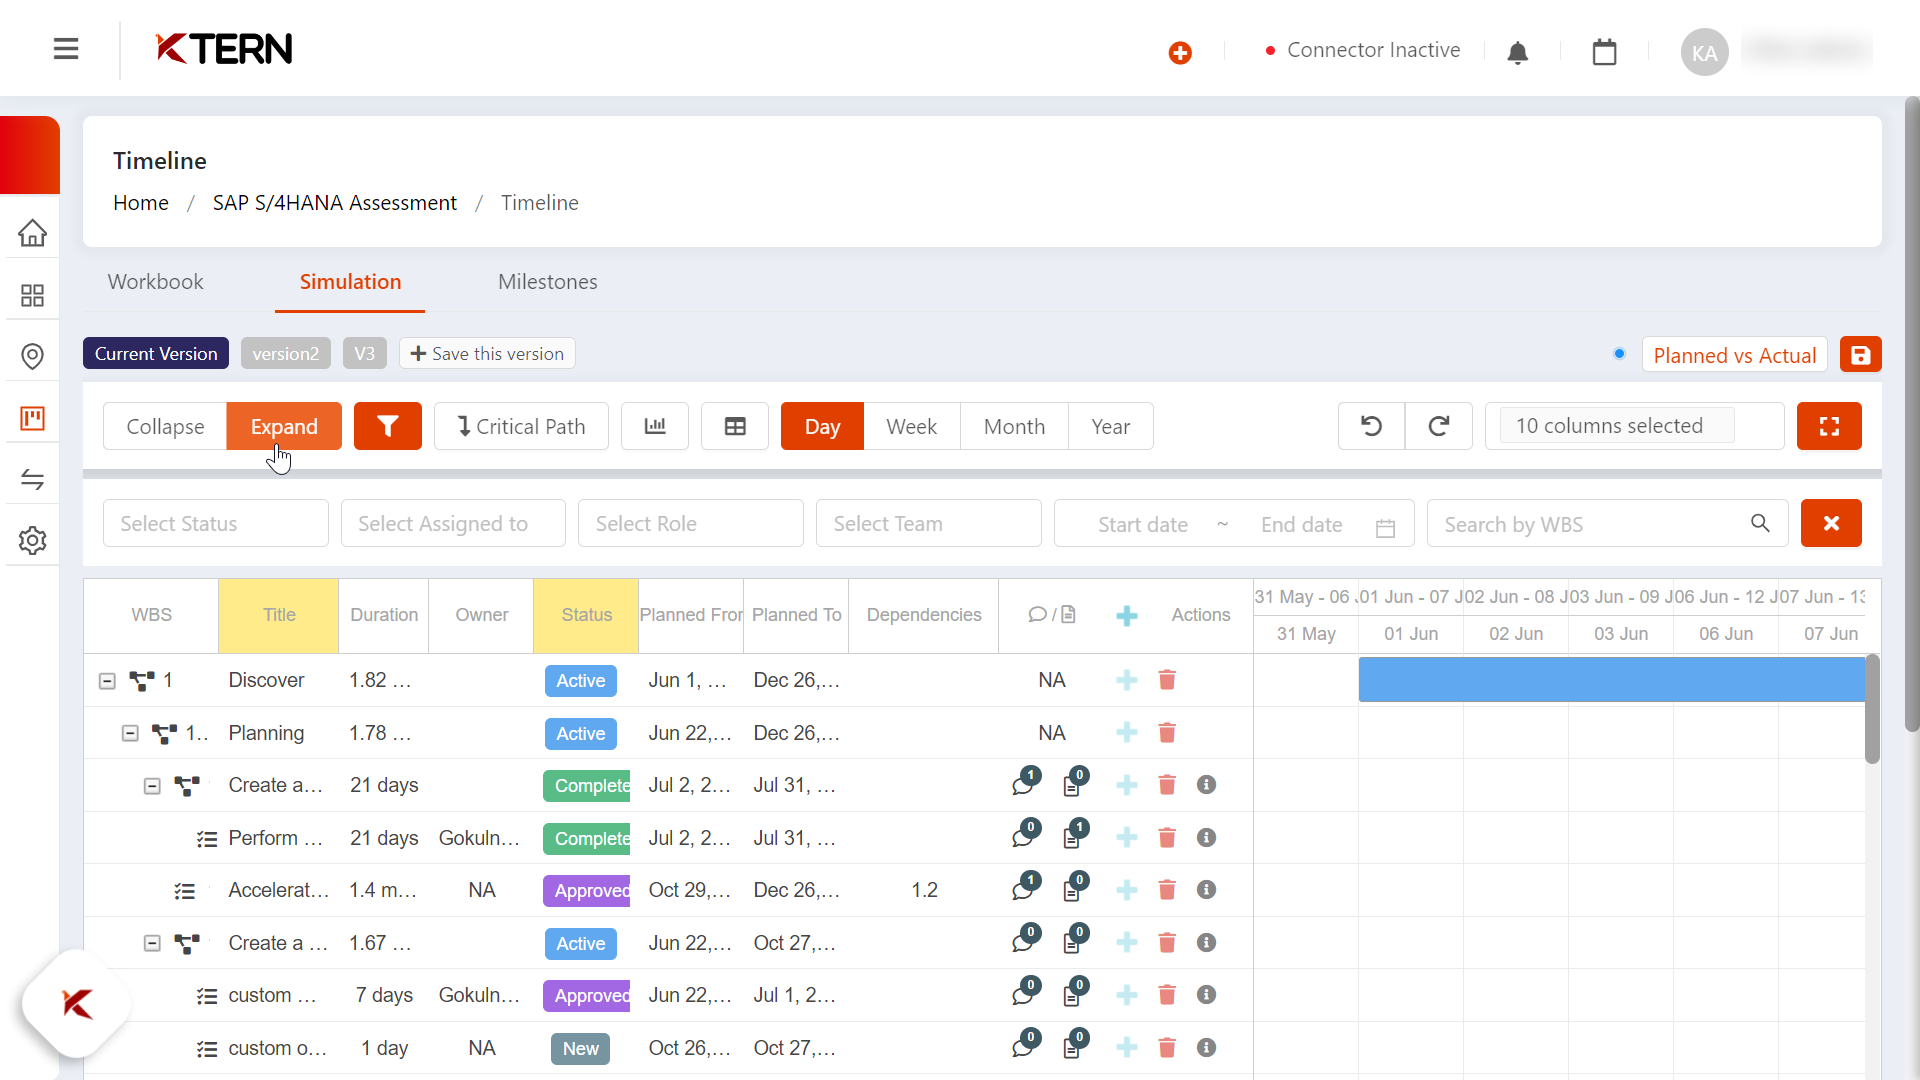
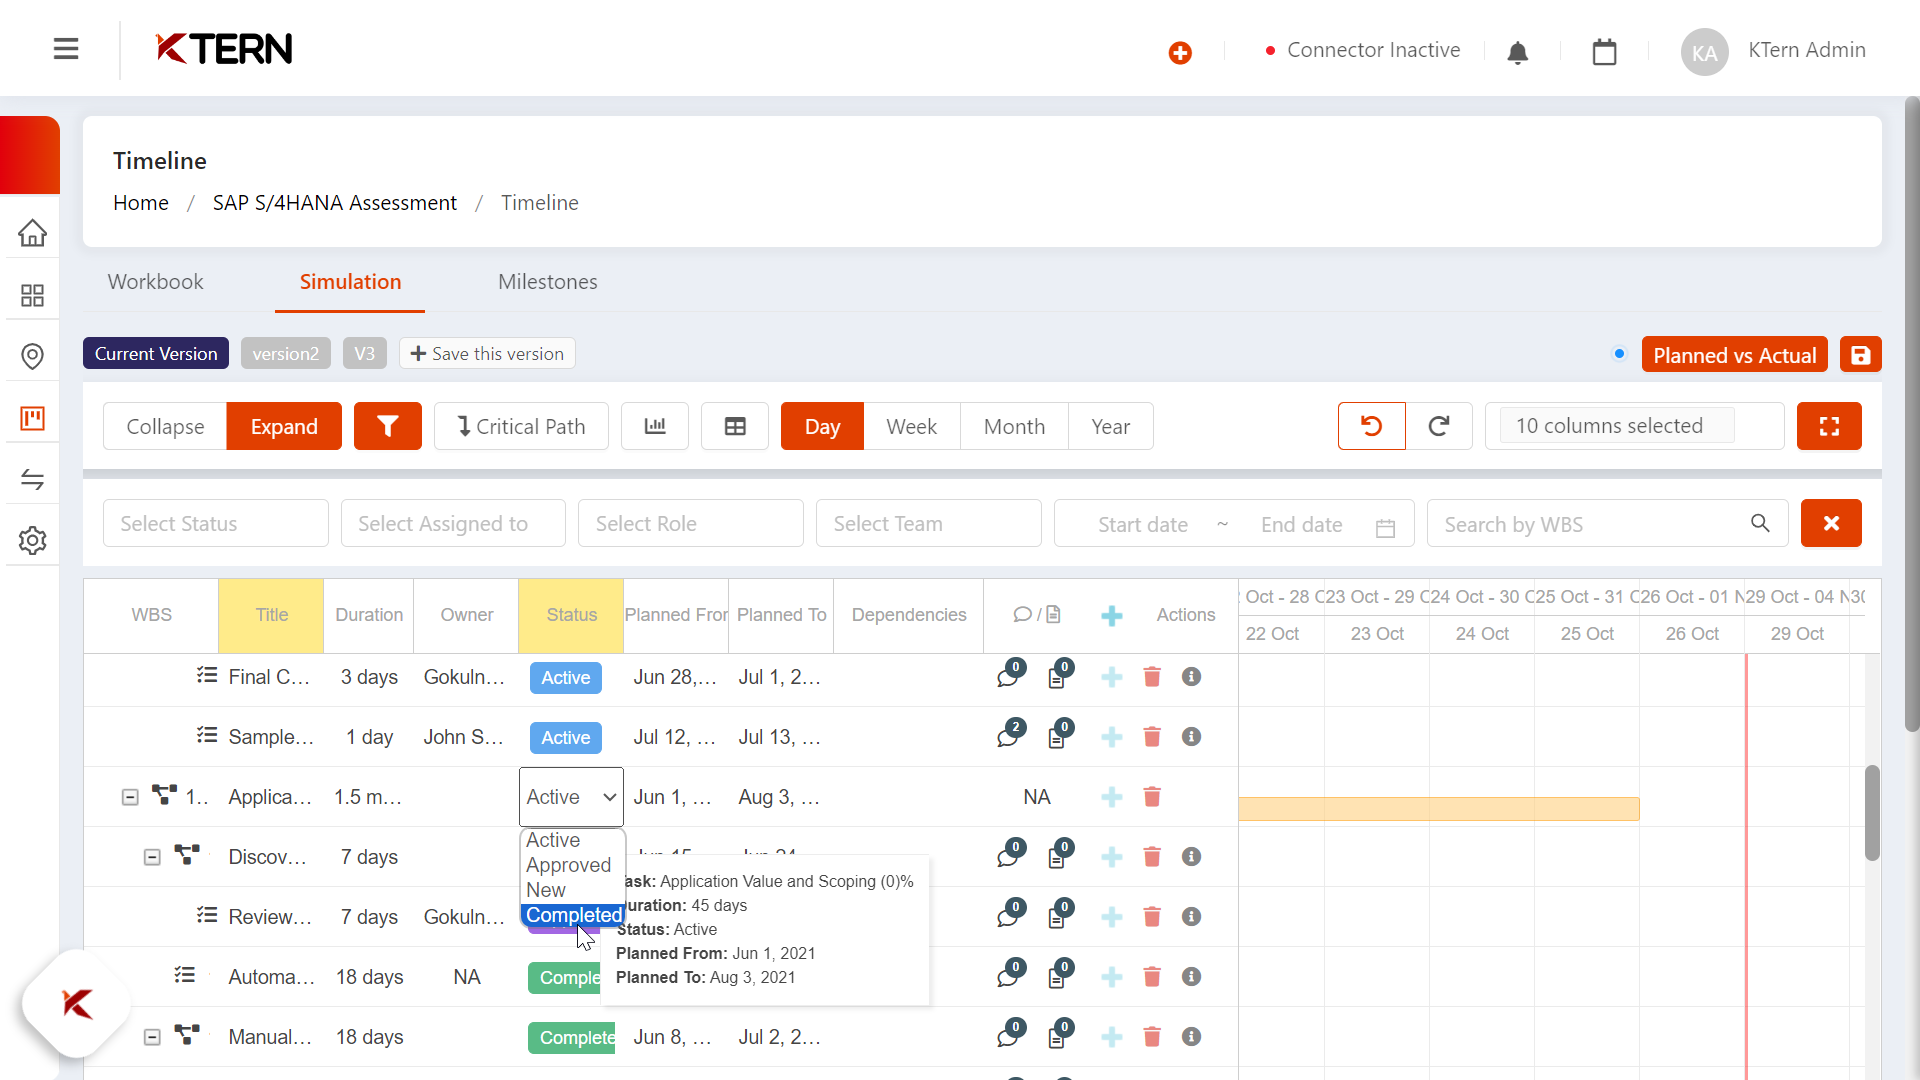
In Collapse View, the user has the convenience to view in a high-level manner (phase level). In Expand View, the user can have a look at each and every work package and tasks under that, providing a versatile perspective.
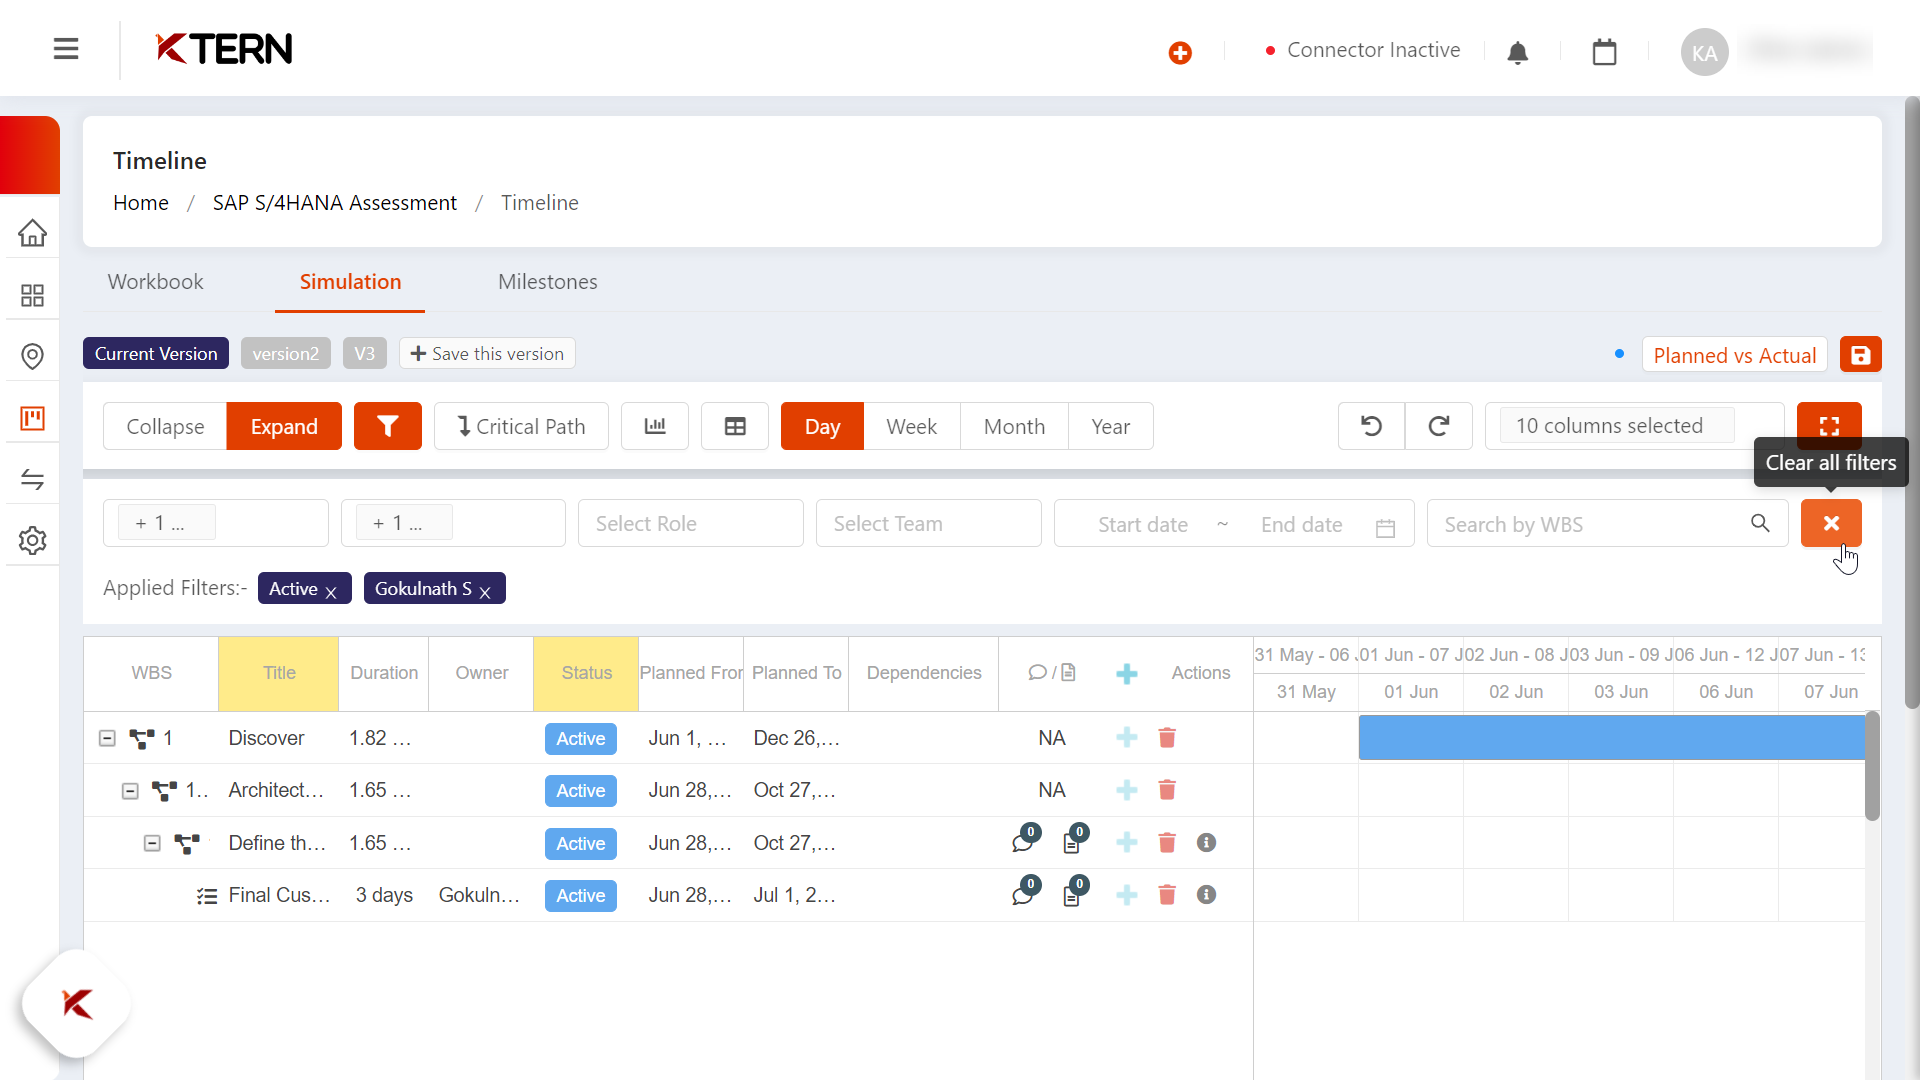
To ease the user experience, filters can be used. If that's not required, the list of filter options can be hidden, minimizing clutter.
Applied filters can be removed by a single click over the cross mark, simplifying the filter management.
The progress of the project can be monitored by comparing the planned vs. actual progress. The redo and undo option is also available, offering control over changes.
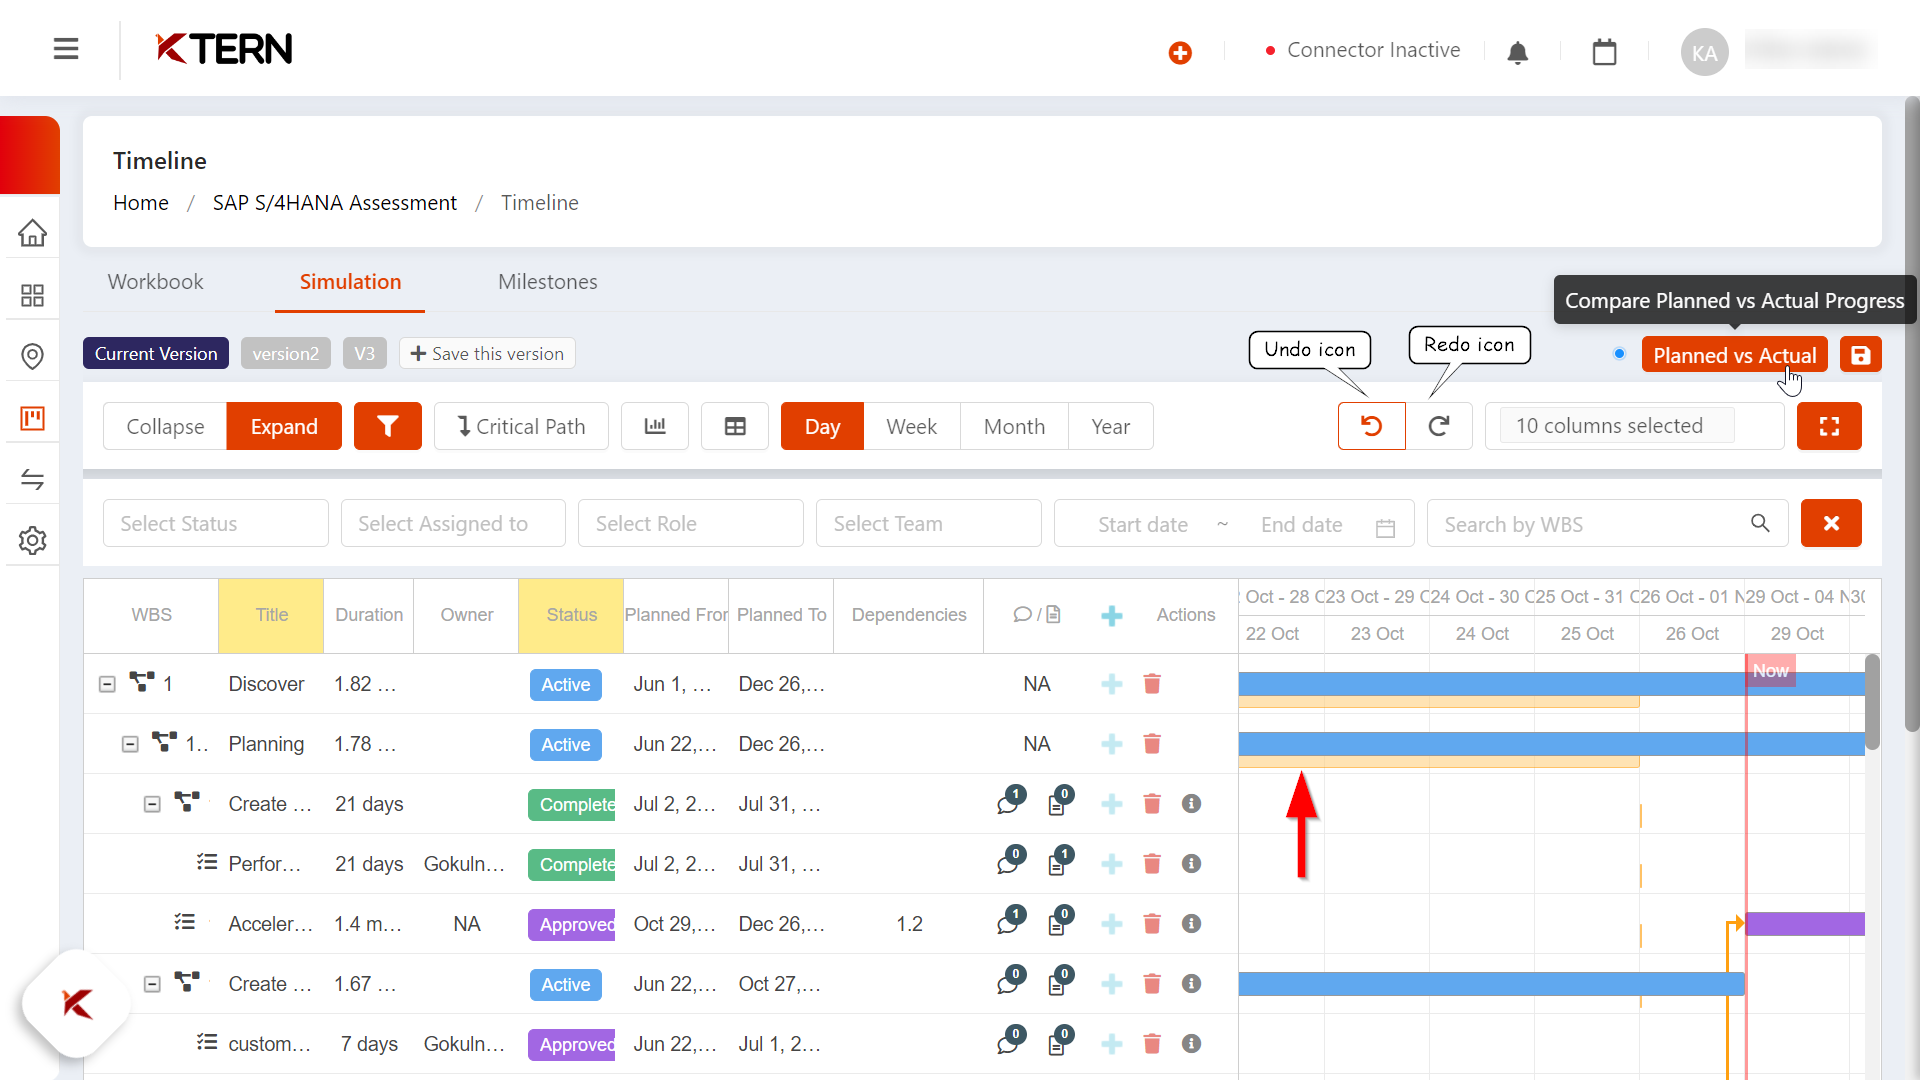
If the user has to complete a task named B and then the task A, the user could add the WBS of task B under the dependencies column of task A. After saving that, a lined arrow mark can be seen from downwards (task B) to upwards (task A), enhancing task management.
Inline editing of the status can be done here, after which save button has to be triggered, streamlining status updates.
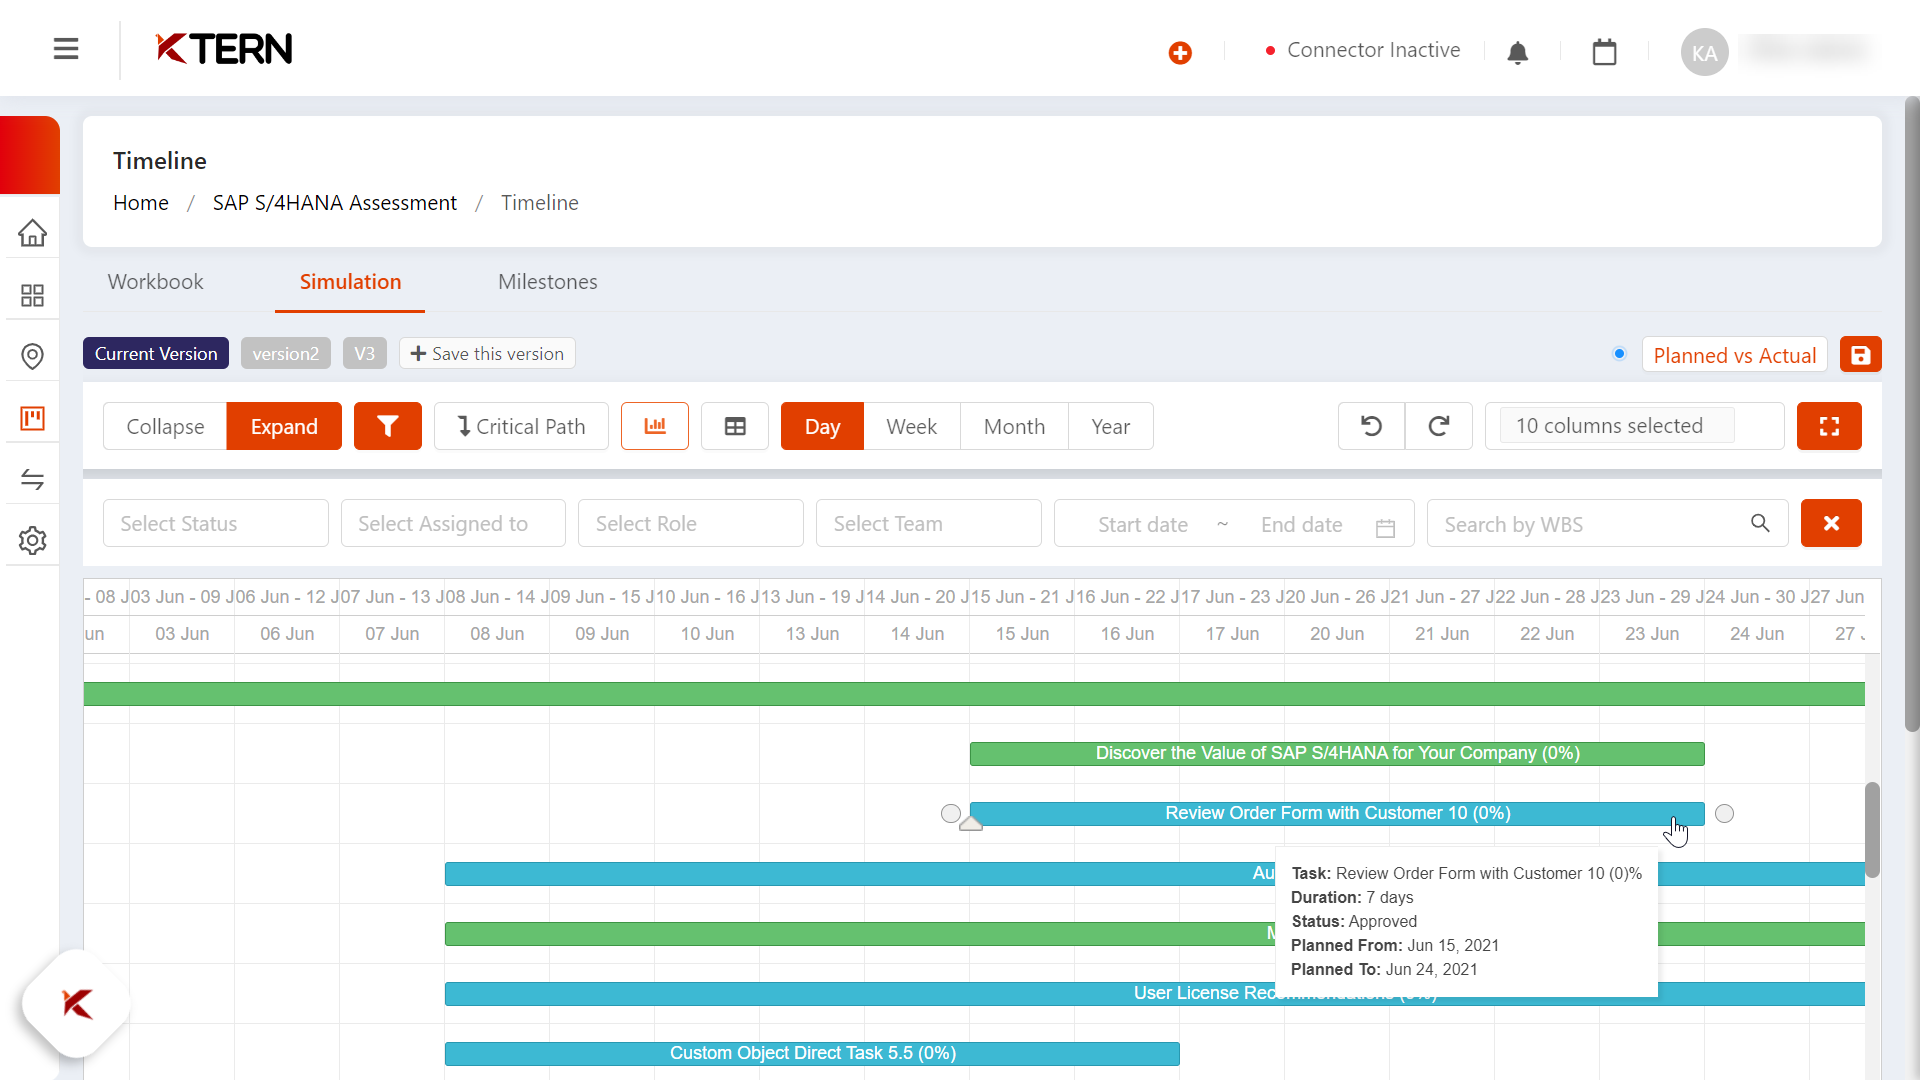
The icon present to the right of the critical path button is called the "Gantt view" icon, which shows the progress in a graph manner, highlighting the phase and work package name on it. On hovering on each of the line bar, the user can view the name of the task, duration of the task, status, planned from and planned to dates, offering a visual overview.
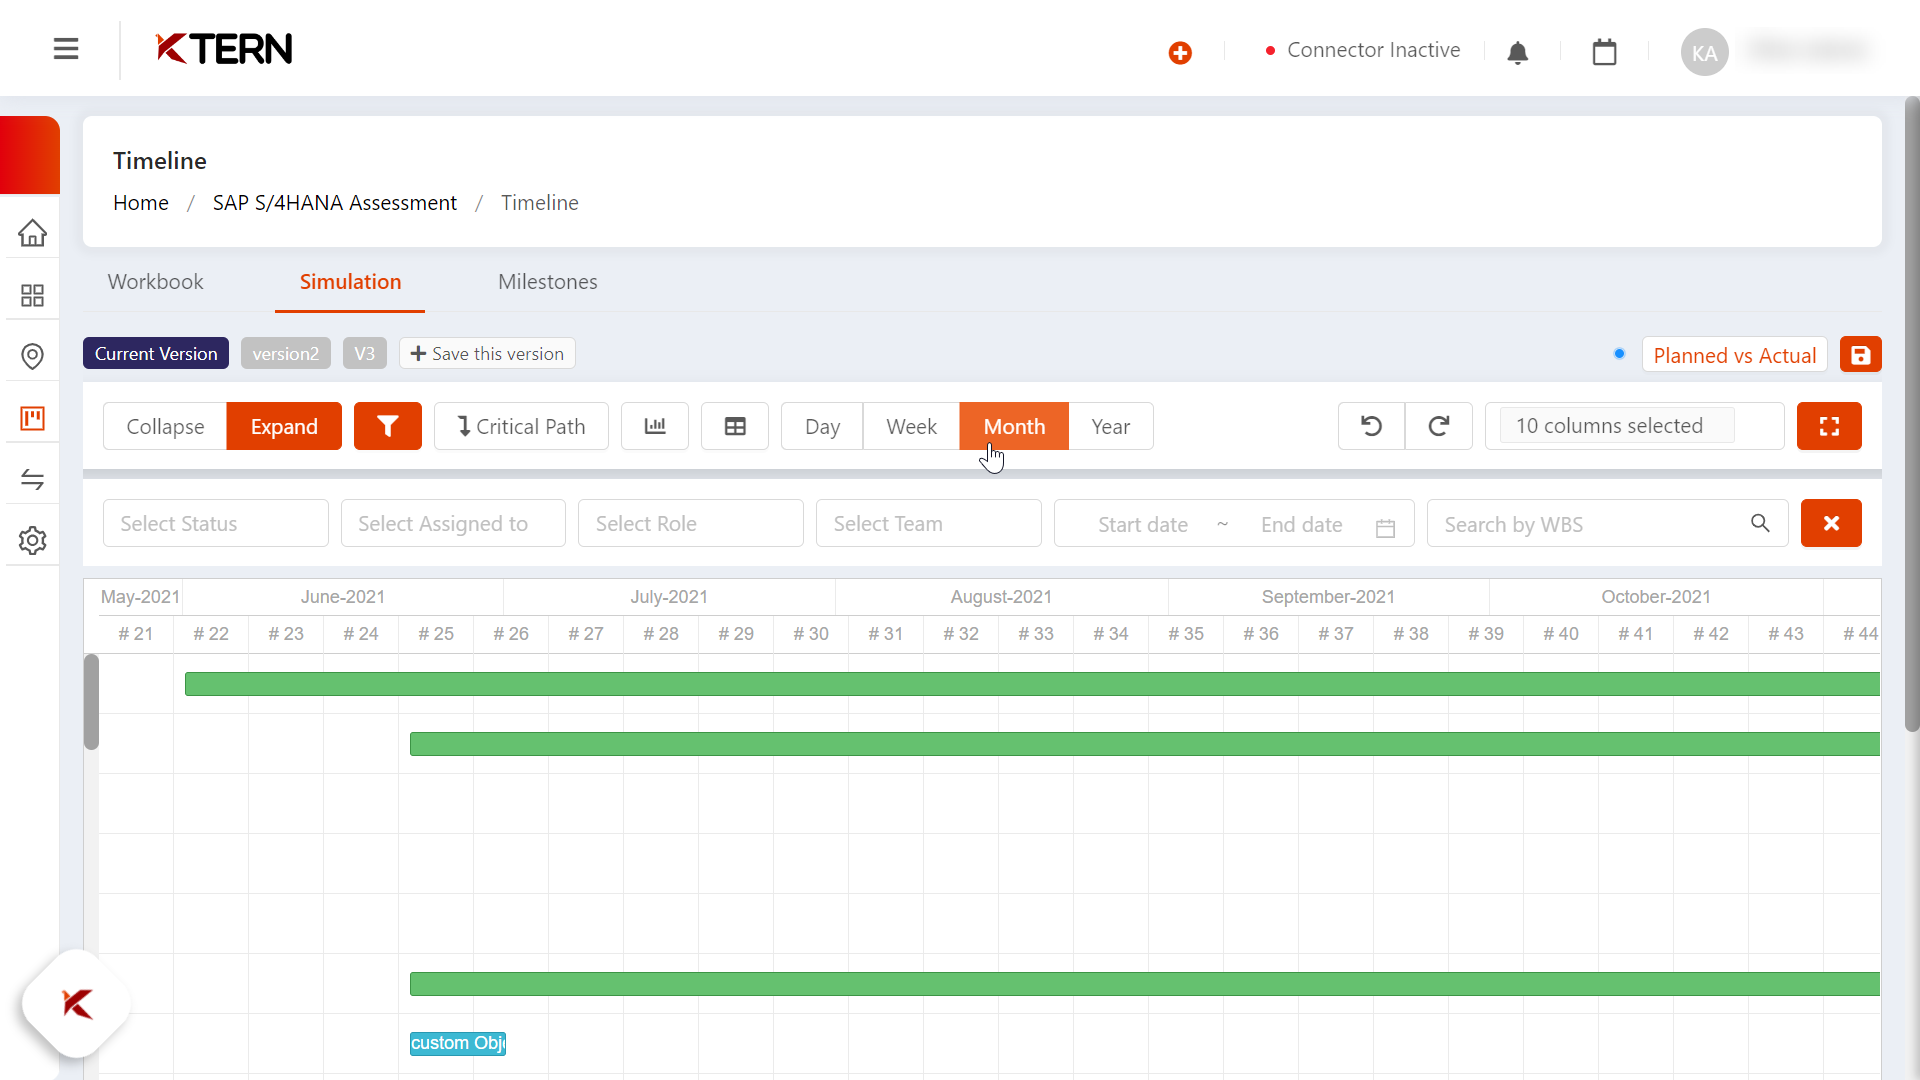
Under Gantt view, the user can view "day/week/month/year-wise based on their need, providing flexibility in data representation.
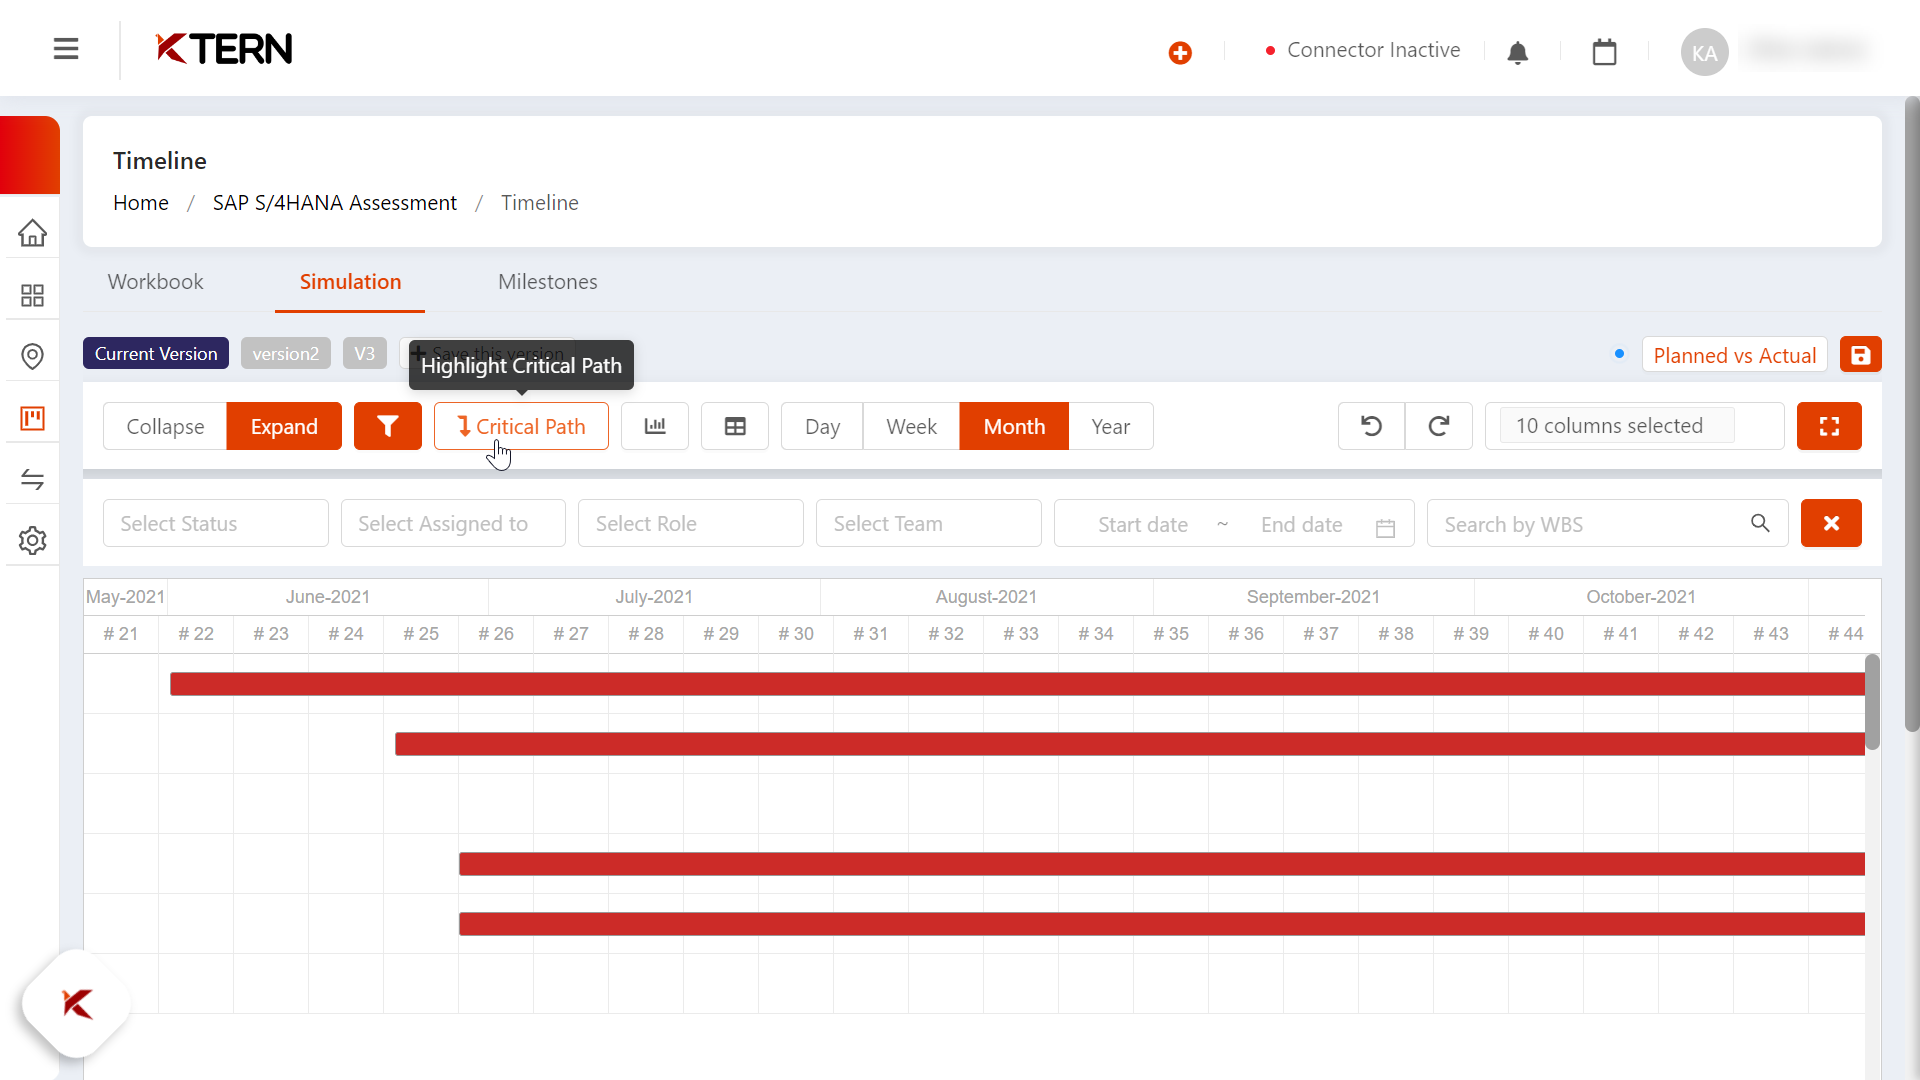
On clicking the "Critical Path", the phase/work package/tasks which are at risk and left incomplete will be highlighted with a red color bar, ensuring risk identification.
The icon present to the right of the Gantt view icon is called the "Grid view" icon. This shows everything (Phase, work package, tasks levels) in a hierarchical manner along with the stats, dependencies, no. of files attached to it, and count of the comments made inside that. Also, on clicking "i" icon, the tasks drawer will get opened, making it easy to access comprehensive project details.
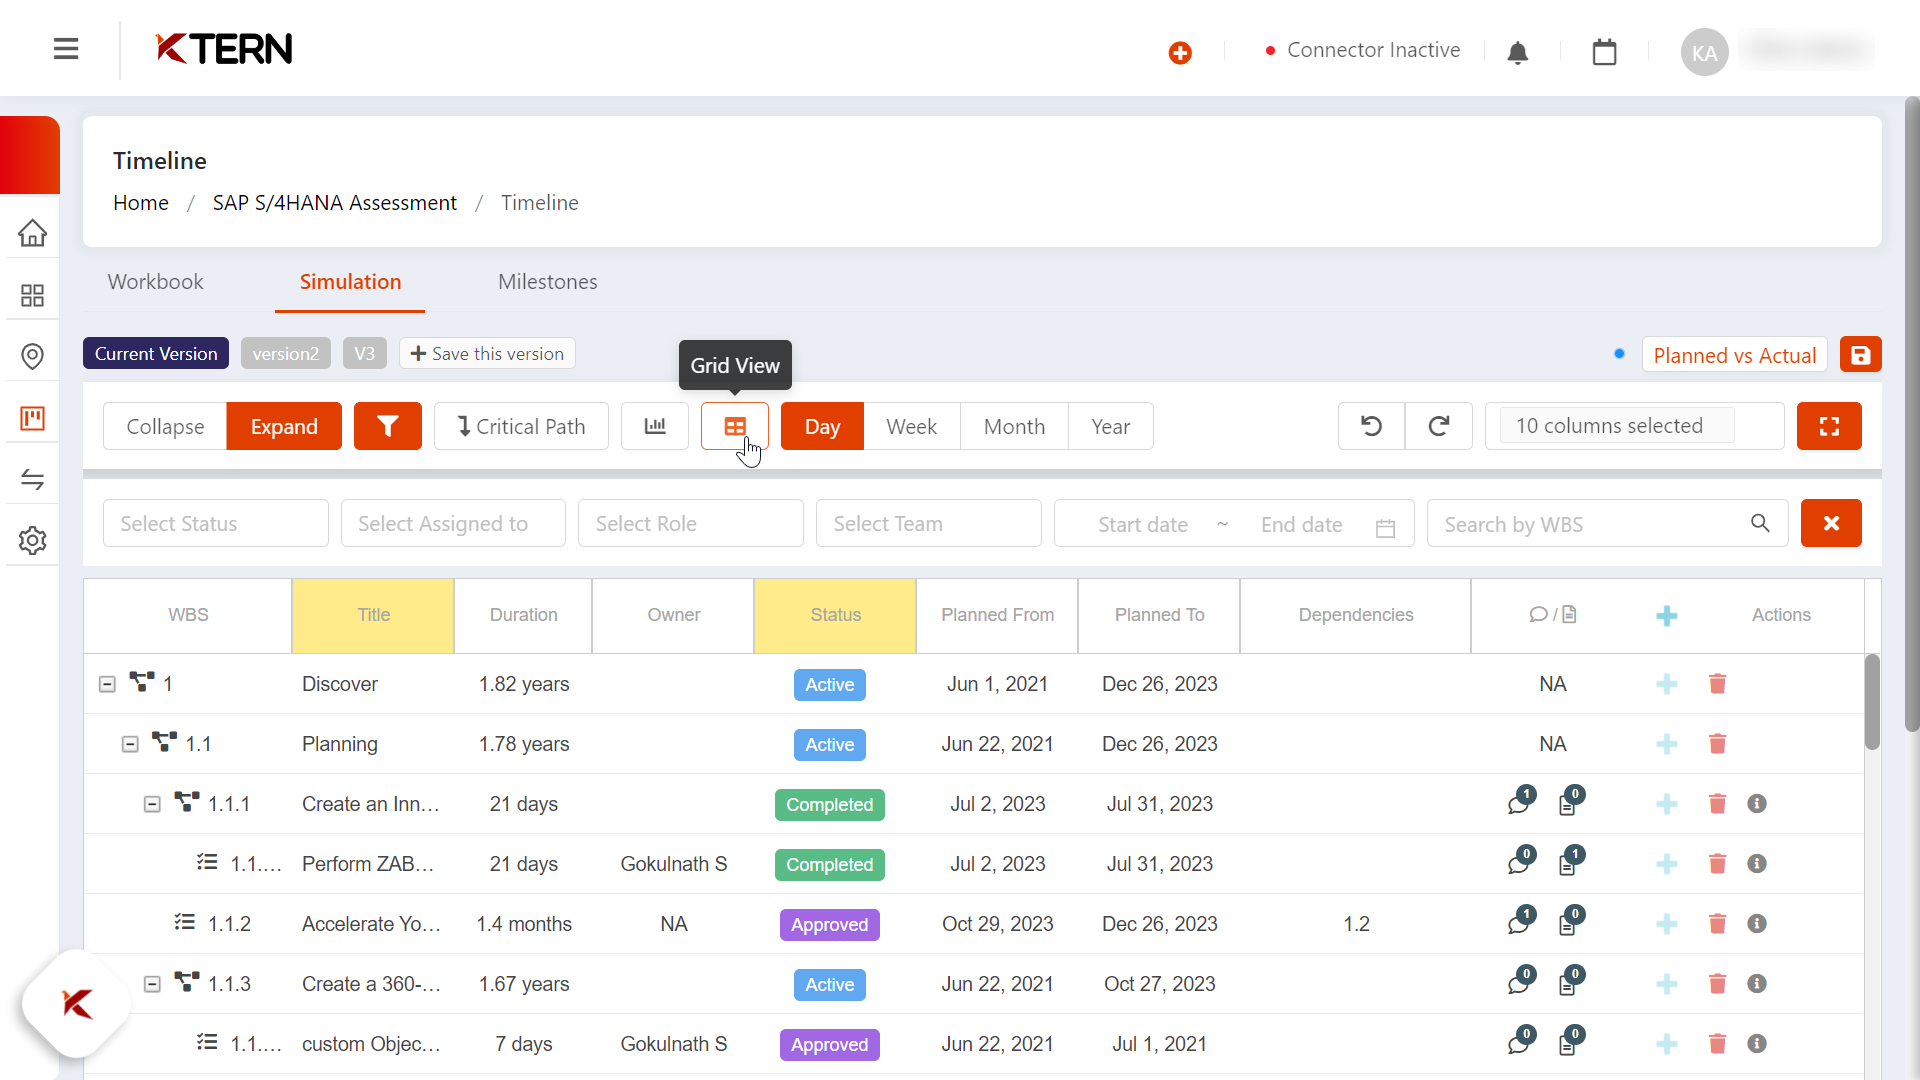
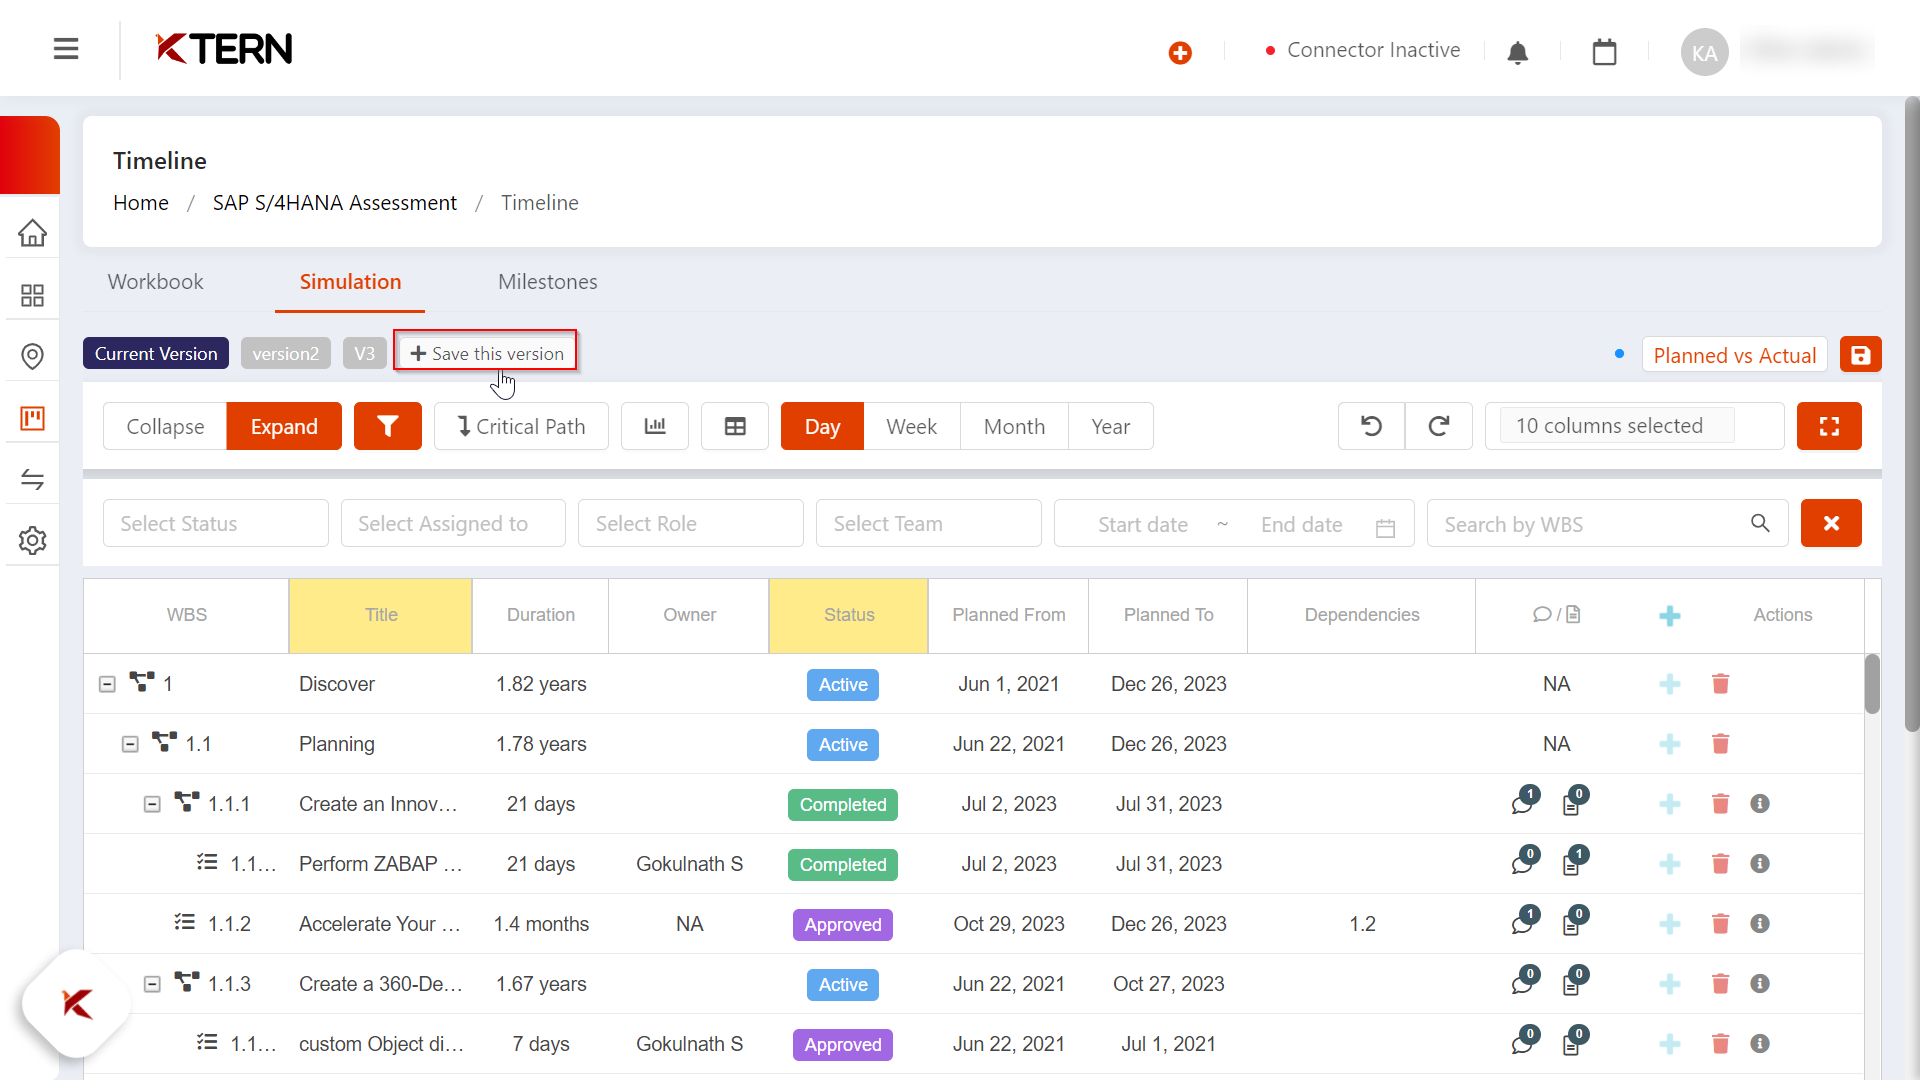
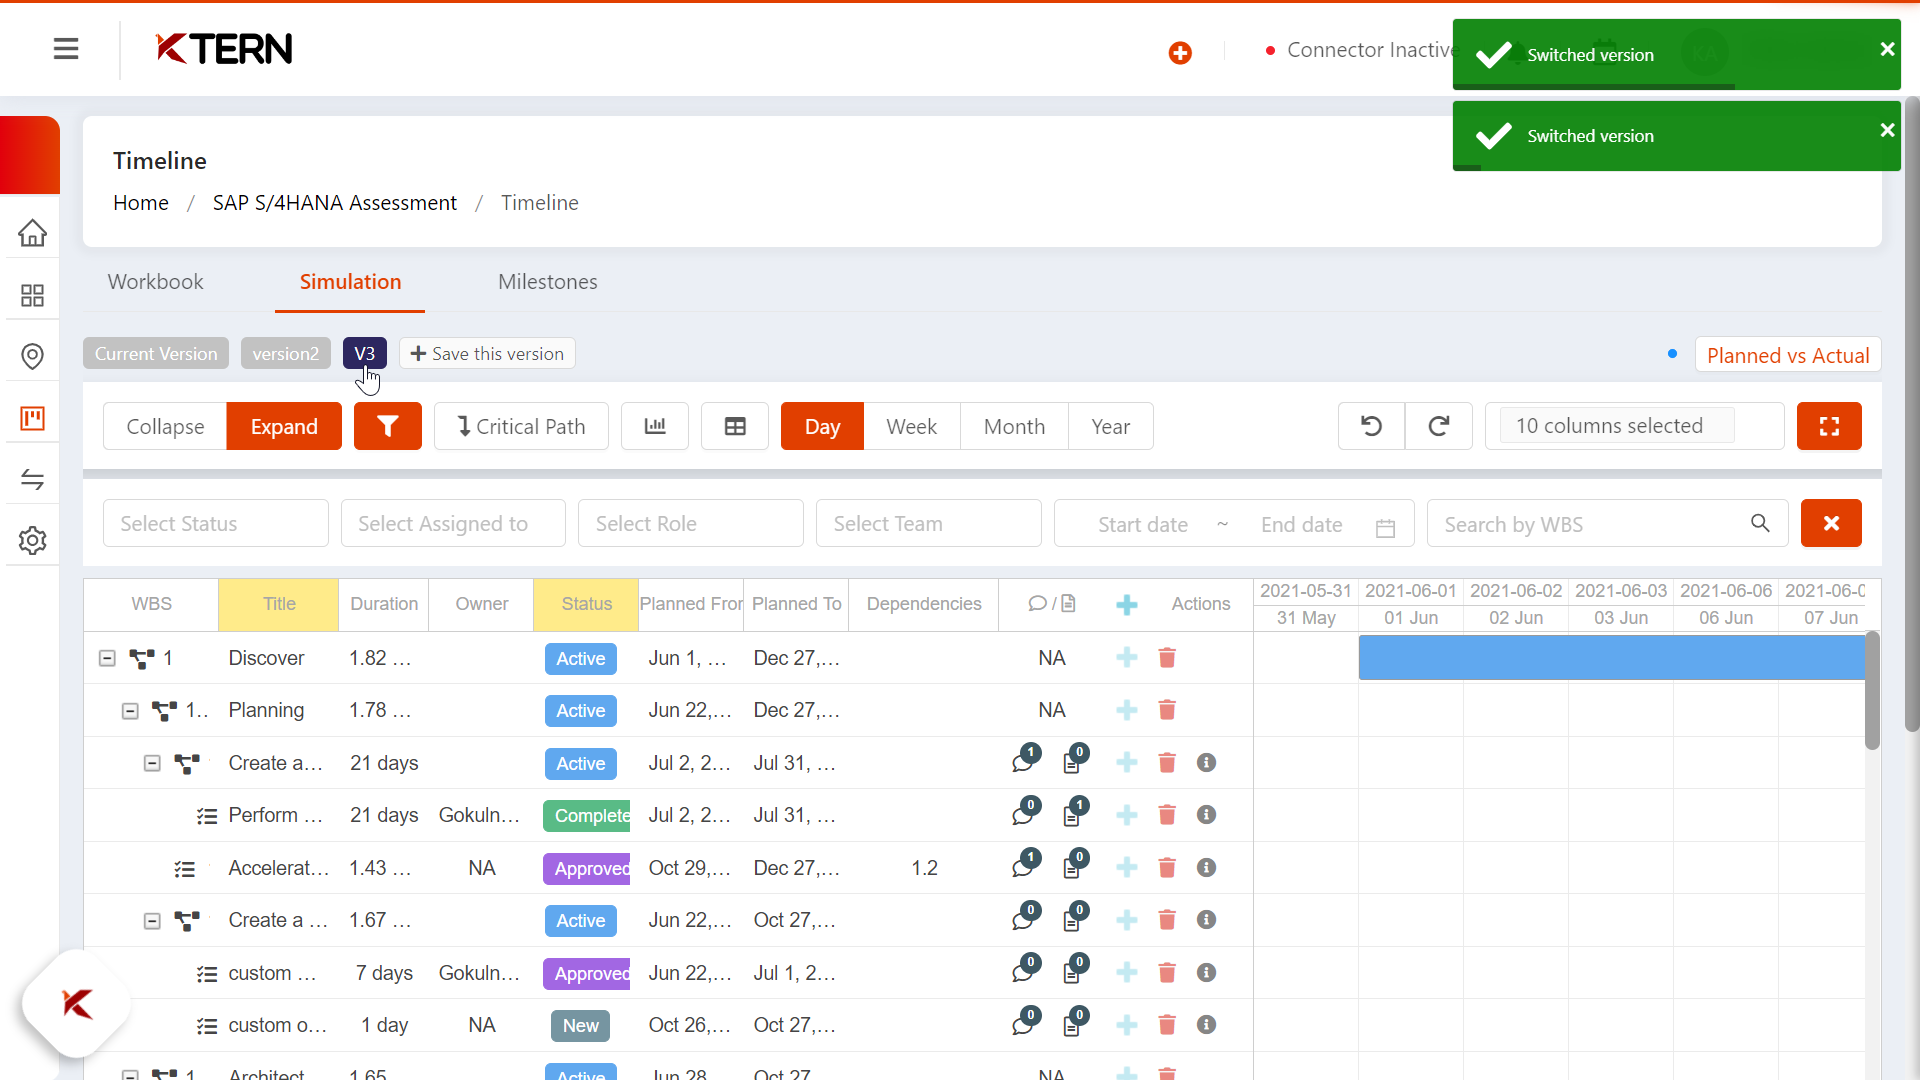
If the user has to take a copy of the plan having the updates as a part of "X" month or based on the filters that they applied, it is possible through clicking the "Save this version" and give a name for that version plan and just press enter, simplifying version management.
To resize the table for a convenient view with choosing only the required columns, the user can customize their workspace for a more focused view.
At the bottom of the page, the user can access a valuable resource allocation section. This section offers a detailed view of the resources allocated to each person in the project, alongside important information such as the hours per day and tasks per day for every stakeholder. This data provides crucial insights for effective project management.
Related Articles
How Can You Effectively Use KTern’s New Simulation Planner?
To begin, log in to KTern and navigate to the desired project. Follow the steps below to access and utilize the Simulation Planner effectively: Navigating to the Wave Landing Page and Planner Preview Once logged in, go to the Timeline under Digital ...
How Project Planning Can Be Done Effectively Using KTern's Workbook ?
KTern.AI-Workbook provides you with the option of updating your project using the workbook. Timeline is a place where users can add and edit tasks in the auto-generated project plan. The workbook is a view similar to excel sheet where all the tasks ...
How Workstream Tasks Can Be Governed Effectively Using KTern.AI ?
Workstream in KTern.AI A workstream refers to a specific component or segment of work within a larger project or organizational framework. It represents a focused area of activity that contributes to achieving overall project goals or organizational ...
Key Features Of Simulation
User can collapse of expand based on the level, This would help the user to view the plan they way they prefer it. To ease the user experience, filters can be used to effectively govern the project. If the user has to complete a task named B and then ...
How To Manage Dependencies In Simulation?
To add dependencies for a work item, follow the steps mentioned below: Click on “Hamburger” icon. Click on Digital projects and click on Timeline. In timeline, click on Simulation. Now, under dependencies, click over a desired task to add a suitable ...