How To Govern Your Testing Life Cycle?
- The dedicated section for managing testing-related activities can be accessed by selecting Digital Labs from the dropdown menu.
- Within the Digital Labs dropdown menu, the user has access to the Test Cockpit and Analytics sections.
A. Test Suite Cockpit
The
testing lifecycle is governed by the Test
Suite Cockpit, which includes the Test Catalog, Insights, Test Suite
Dashboard, and Sign-Off Wizard.
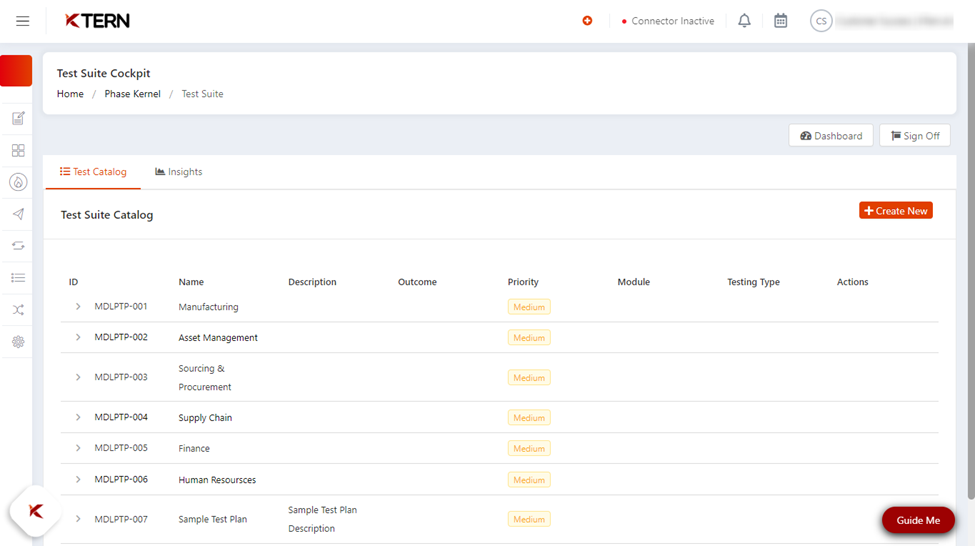
I. Test Catalog
Easy
test execution is enabled by the Test
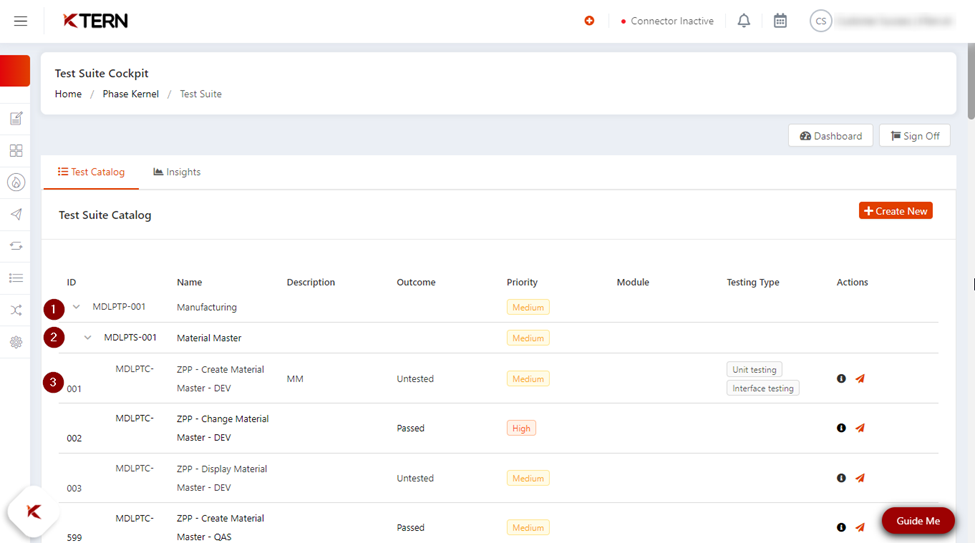
Catalog, which serves as a comprehensive list of test plans (1), scenarios (2), and cases (3). It
organizes test items hierarchically, simplifying navigation and execution for
the user.
Test Case Wizard
- Clicking and launching any test case from the test catalog automatically directs the user to the Test Case Wizard.
- The Test Case Wizard, with its various tabs, plays
a crucial role in governing the testing lifecycle and is helpful for the user.
II. Insights
- Users can track and report on test completion in the Insights section of the Test Suite Cockpit.
- It provides comprehensive information about test plans, test scenarios, and test cases, ensuring transparency and a thorough understanding.
- Users can access charts that display assigned test cases for each team member and apply filters using the "Wheel" icon.
- Additionally, they have the flexibility to add new reports and customize their names. Insight reports can be downloaded in Excel format.
B. Analytics or Test Suite Dashboard
The Analytics section can be accessed
either by clicking on the Dashboard
or selecting Analytics from the
dropdown menu on the left.
I. Status of work items
- It allows users to view the status of work items and resource utilization of the test cases and defects.
- The Test Suite Dashboard in KTern acts as a centralized hub for project managers, offering a comprehensive platform to monitor test cases and track the testing process's progress.
- This dashboard provides a visual representation of test cases and defects, allowing project managers to easily assess their status.
- Moreover, it offers a breakdown of work items categorized by modules, business processes, and testing types, providing a structured view of the tasks involved.
- This feature enables project managers to efficiently oversee and manage the testing activities within the project.
II. Resource Utilization Table
- The Resource Utilization Table in KTern offers a comprehensive overview of project stakeholders and testers involved in the project.
- It displays the allocation of test cases to each individual tester for test case execution.
- This table allows you to easily track and manage the distribution of test cases among team members, ensuring efficient utilization of resources and facilitating effective coordination within the testing process.
C.
Transformation Hub
I. Issues Section
- To access the issues section, navigate to the Transformation Hub. Here, you will find a comprehensive list of issues, including their status and the assigned personnel, presented in a user-friendly manner.
- You have the flexibility of filtering the list of issues using various available options, allowing you to tailor the view according to your specific requirements.
- Gain valuable insights by exploring analytical charts that provide an overview of the status of work items within the issues section. Additionally, access dedicated analytics for overdue data to monitor and address any delays.
- Group the list of issues based on attributes such as status, parent task, assigned personnel, and work package, enabling a structured and organized presentation of the information.
II. Test Case Section
- When you explore the test case section of the Transformation Hub, you will discover comparable features to those found in the issues section, such as filtering, grouping, and analytics features, providing a consistent user experience across different areas.
- Leverage the insights screen to create customized reports by selecting the desired parameters in the settings section, offering the same capability as the report generation for issues.
- You can perform bulk editing for both issues and test cases. For example, for editing test cases in bulk, simply select a minimum of two checkboxes to apply changes efficiently.
- Enhance your analysis by downloading filtered data as an Excel file for both issues and test cases. This feature allows you to focus on specific information and work with it in a convenient offline format.