How To Govern Execution Logs?
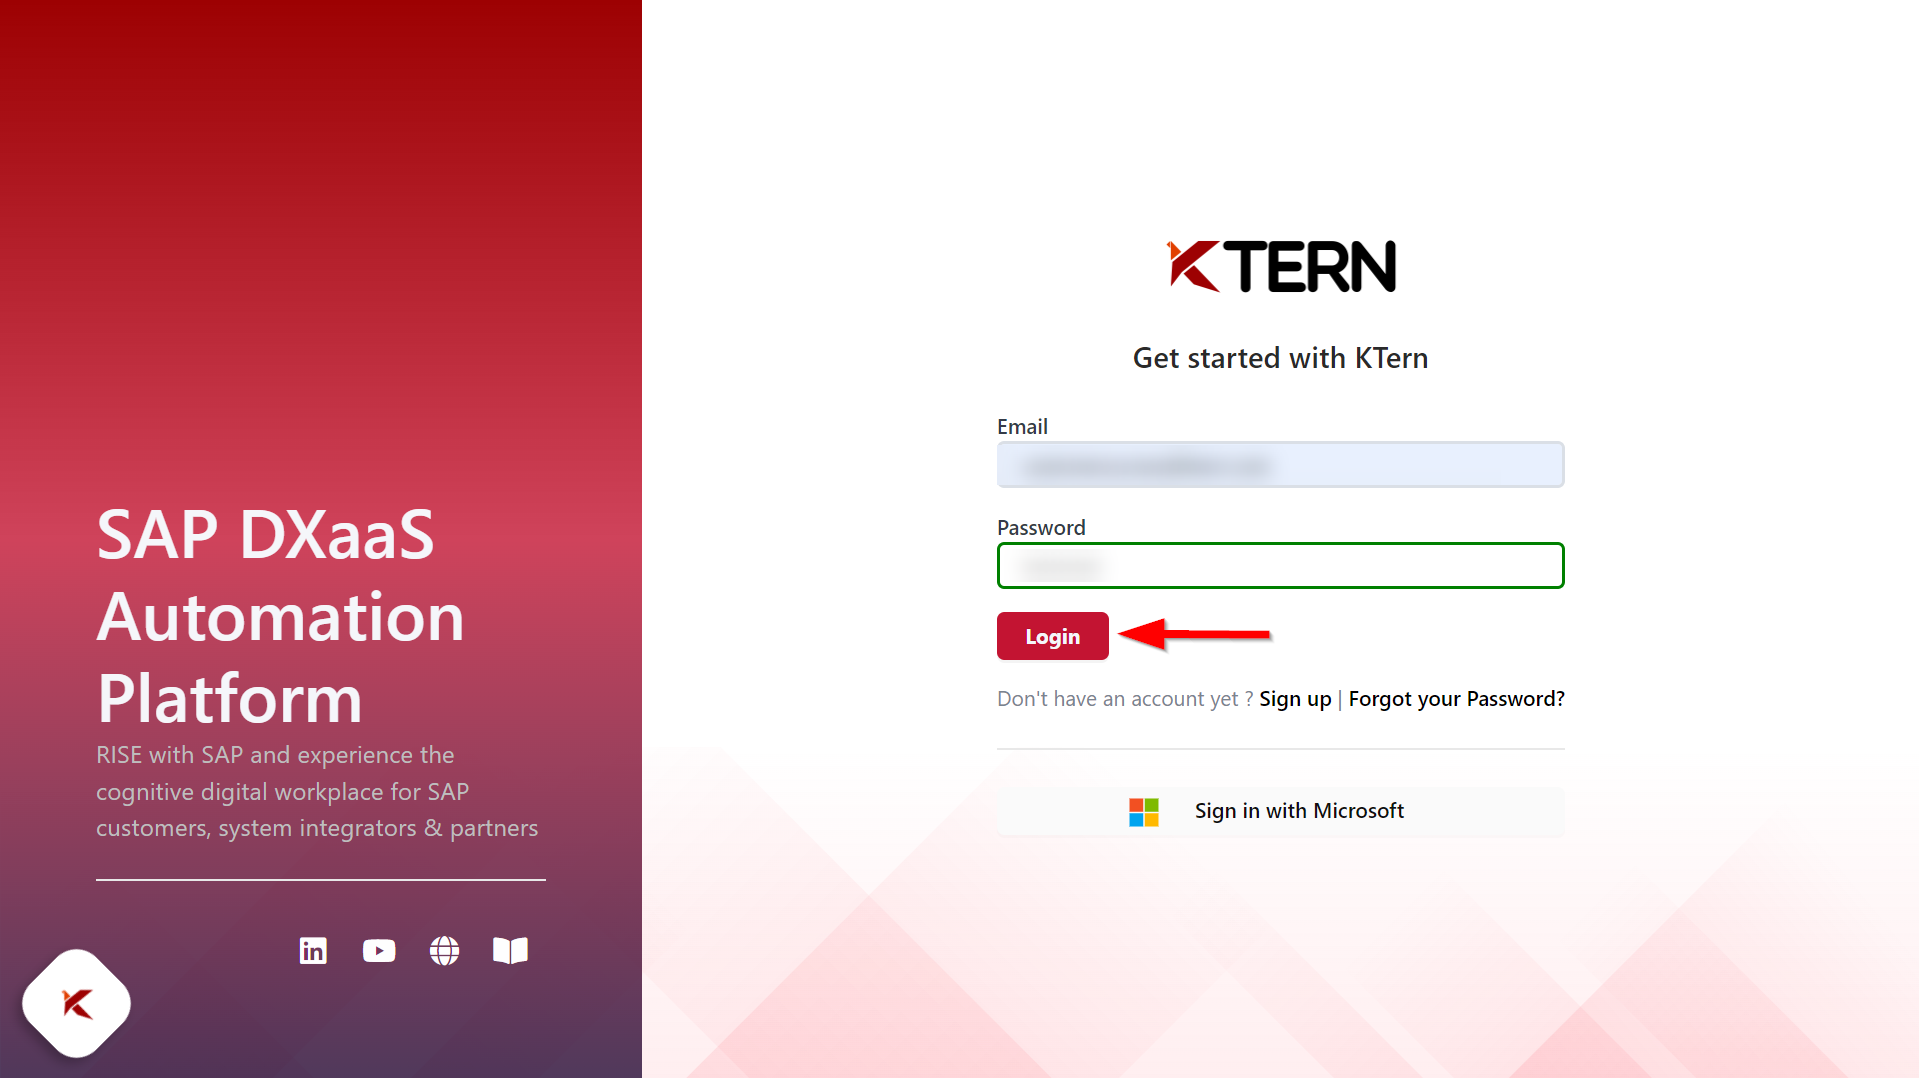
Upon logging into the KTern application, the user will be automatically directed to the Home - Project Launchpad.
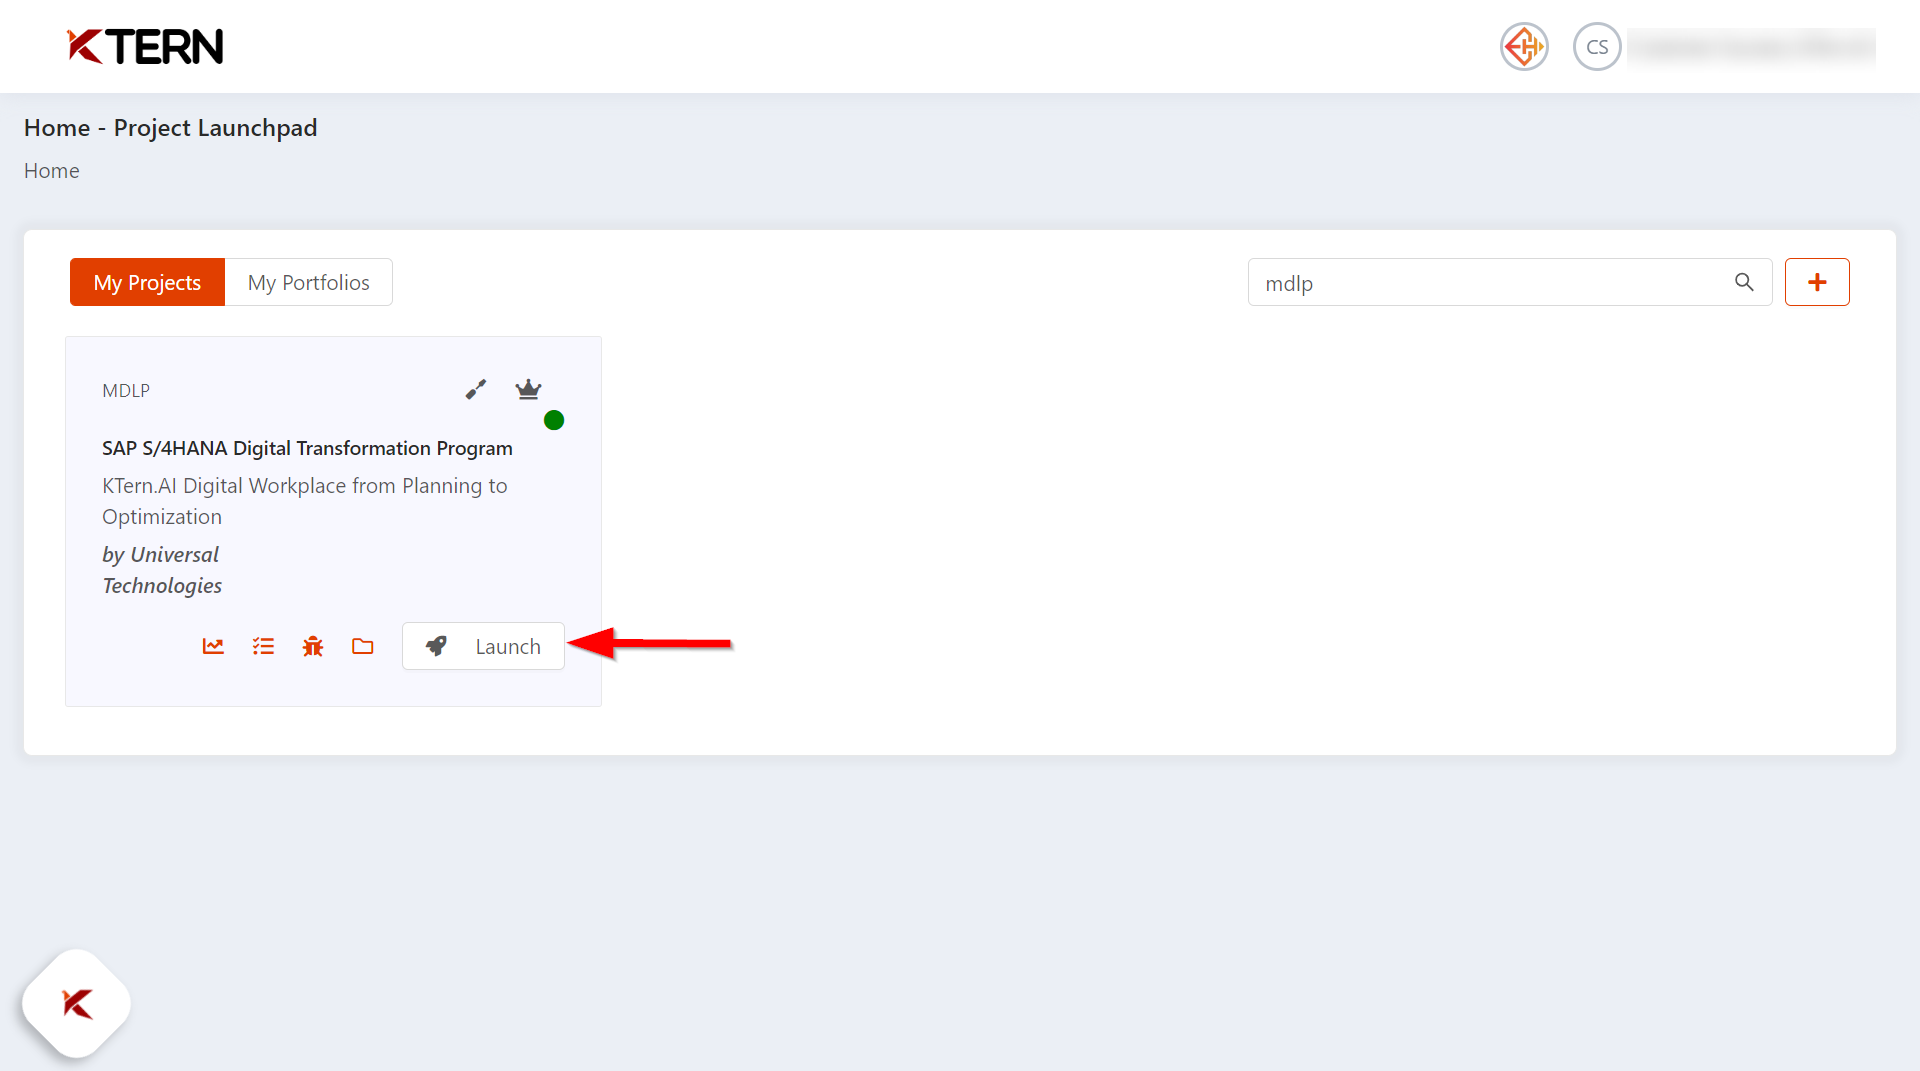
To proceed, launch the desired project by selecting it.
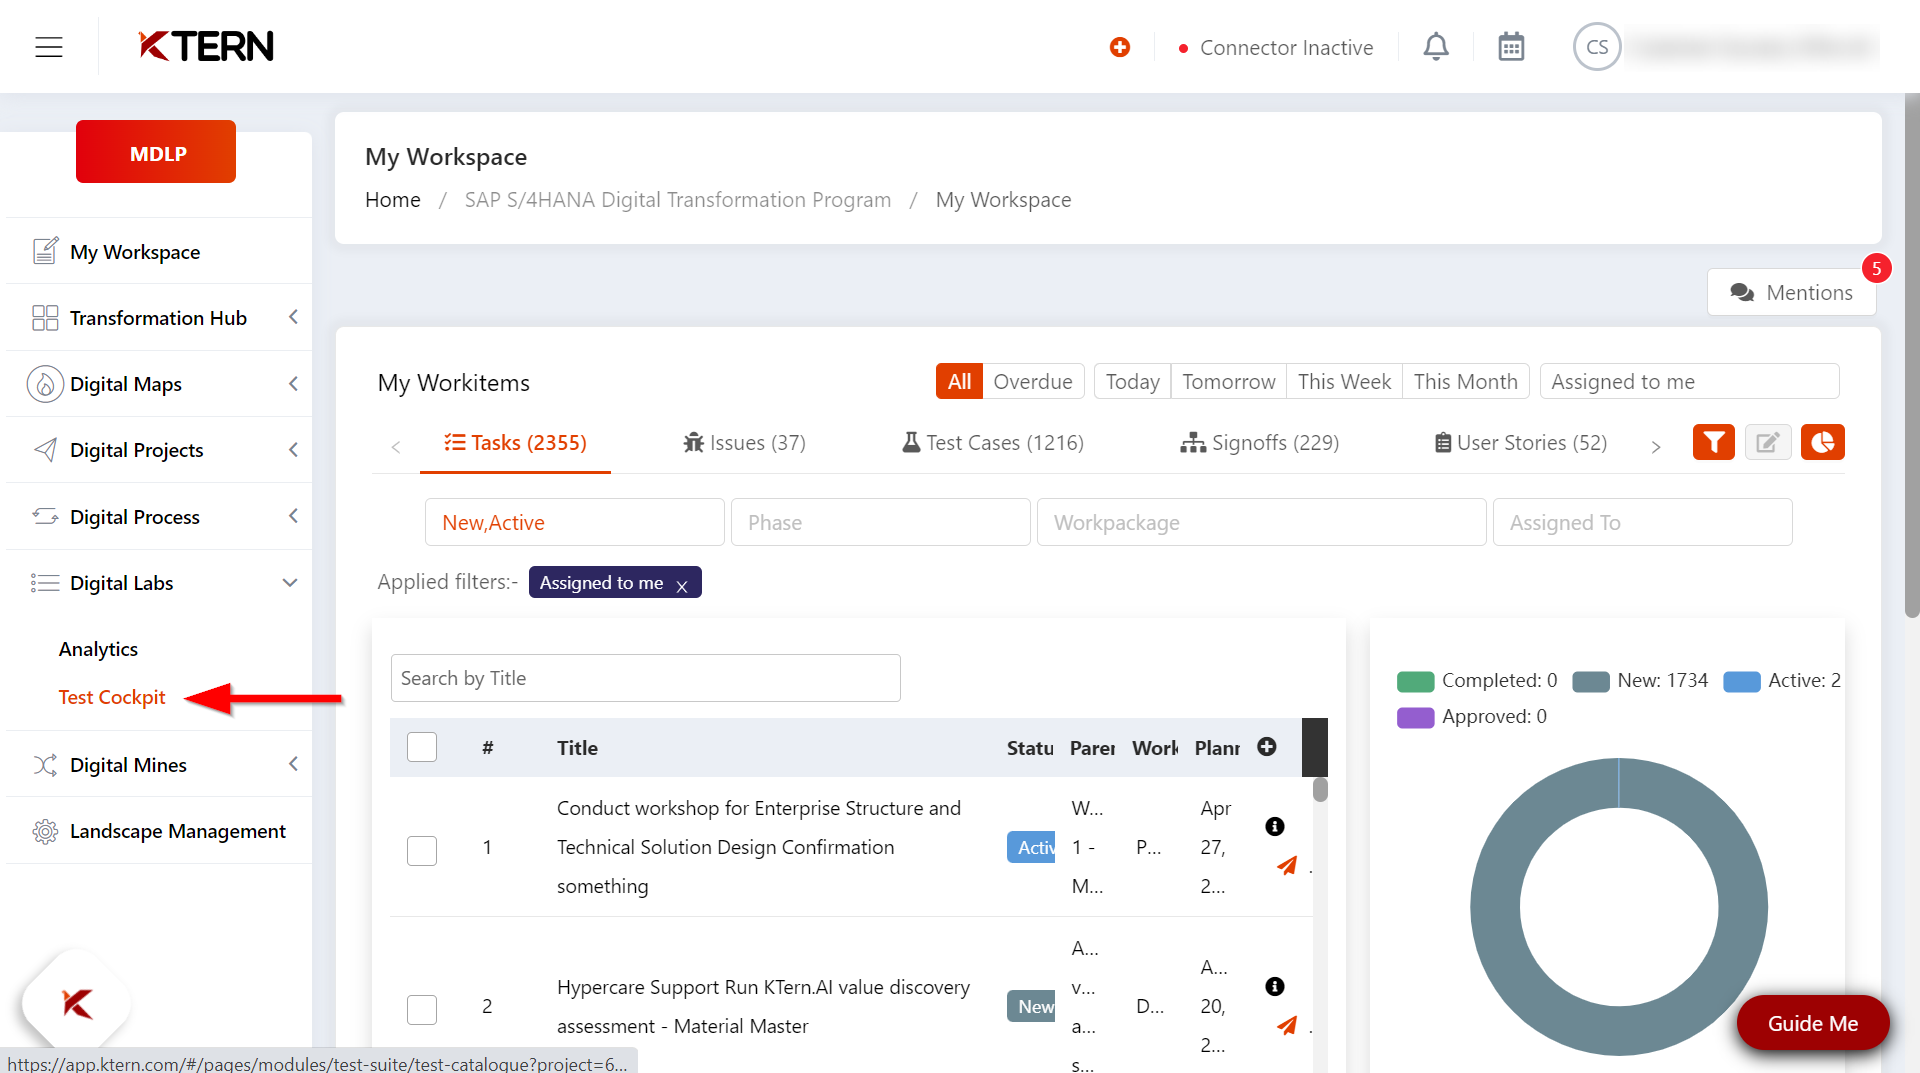
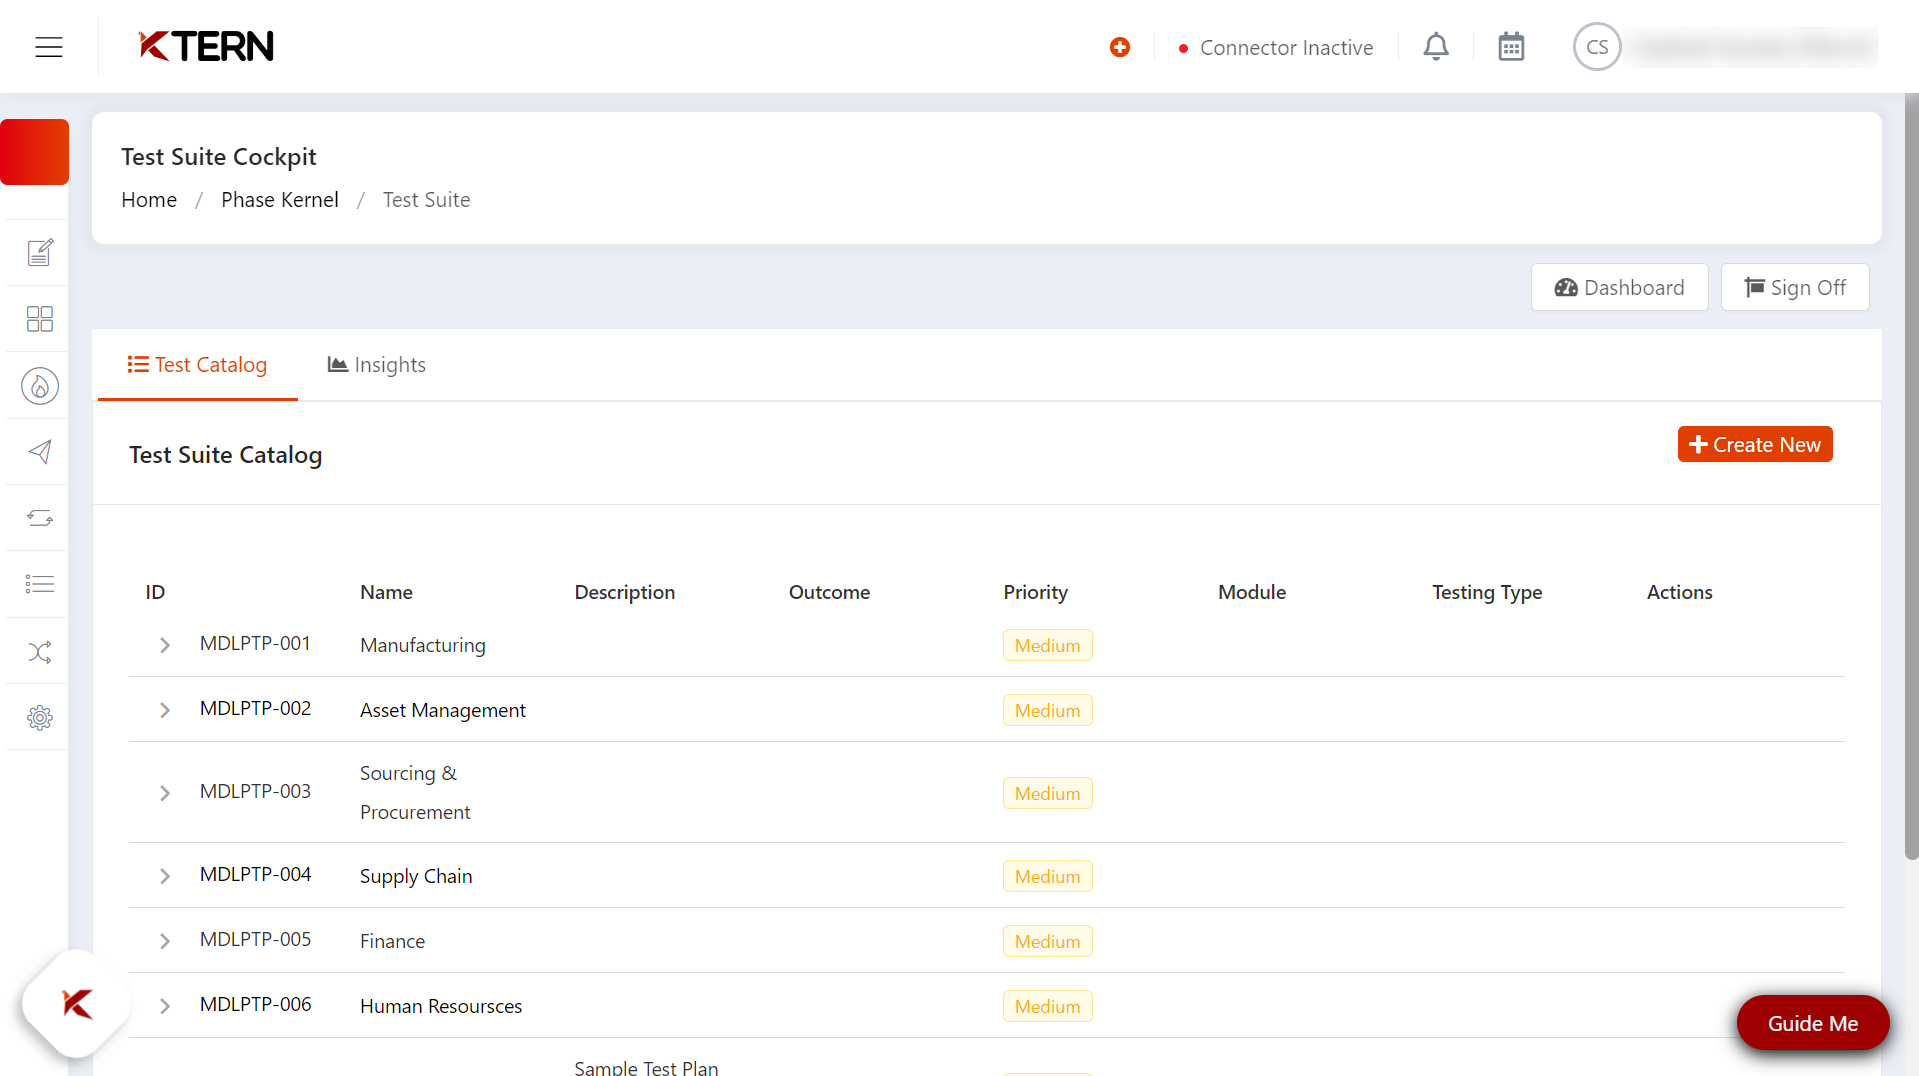
Within the Digital labs dropdown, locate and choose "Test Cockpit." Once the user clicks on "Test Cockpit," they will be redirected to the "Test Catalog."
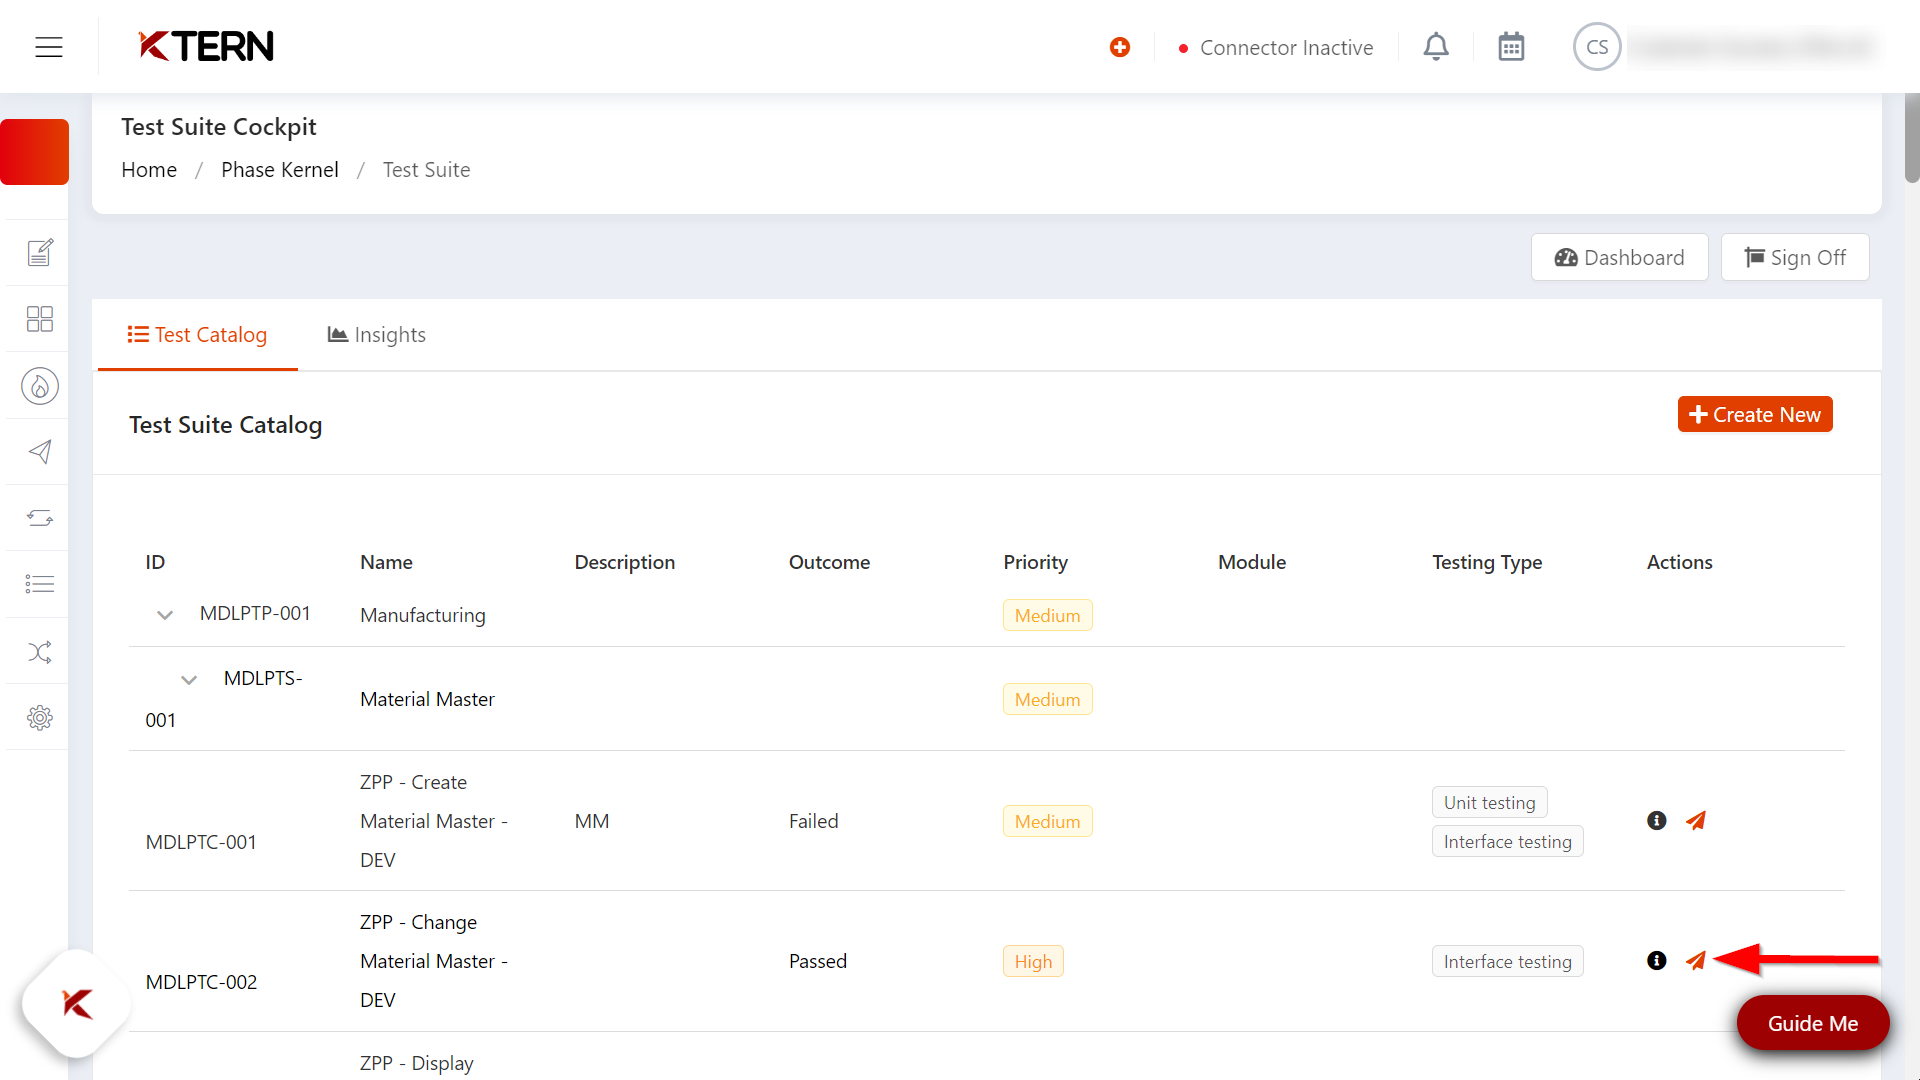
Expand the test plan, and subsequently, the test scenarios, to access the list of available test cases.
Upon launching a test case, the user will be directed to the test center of the test case wizard.
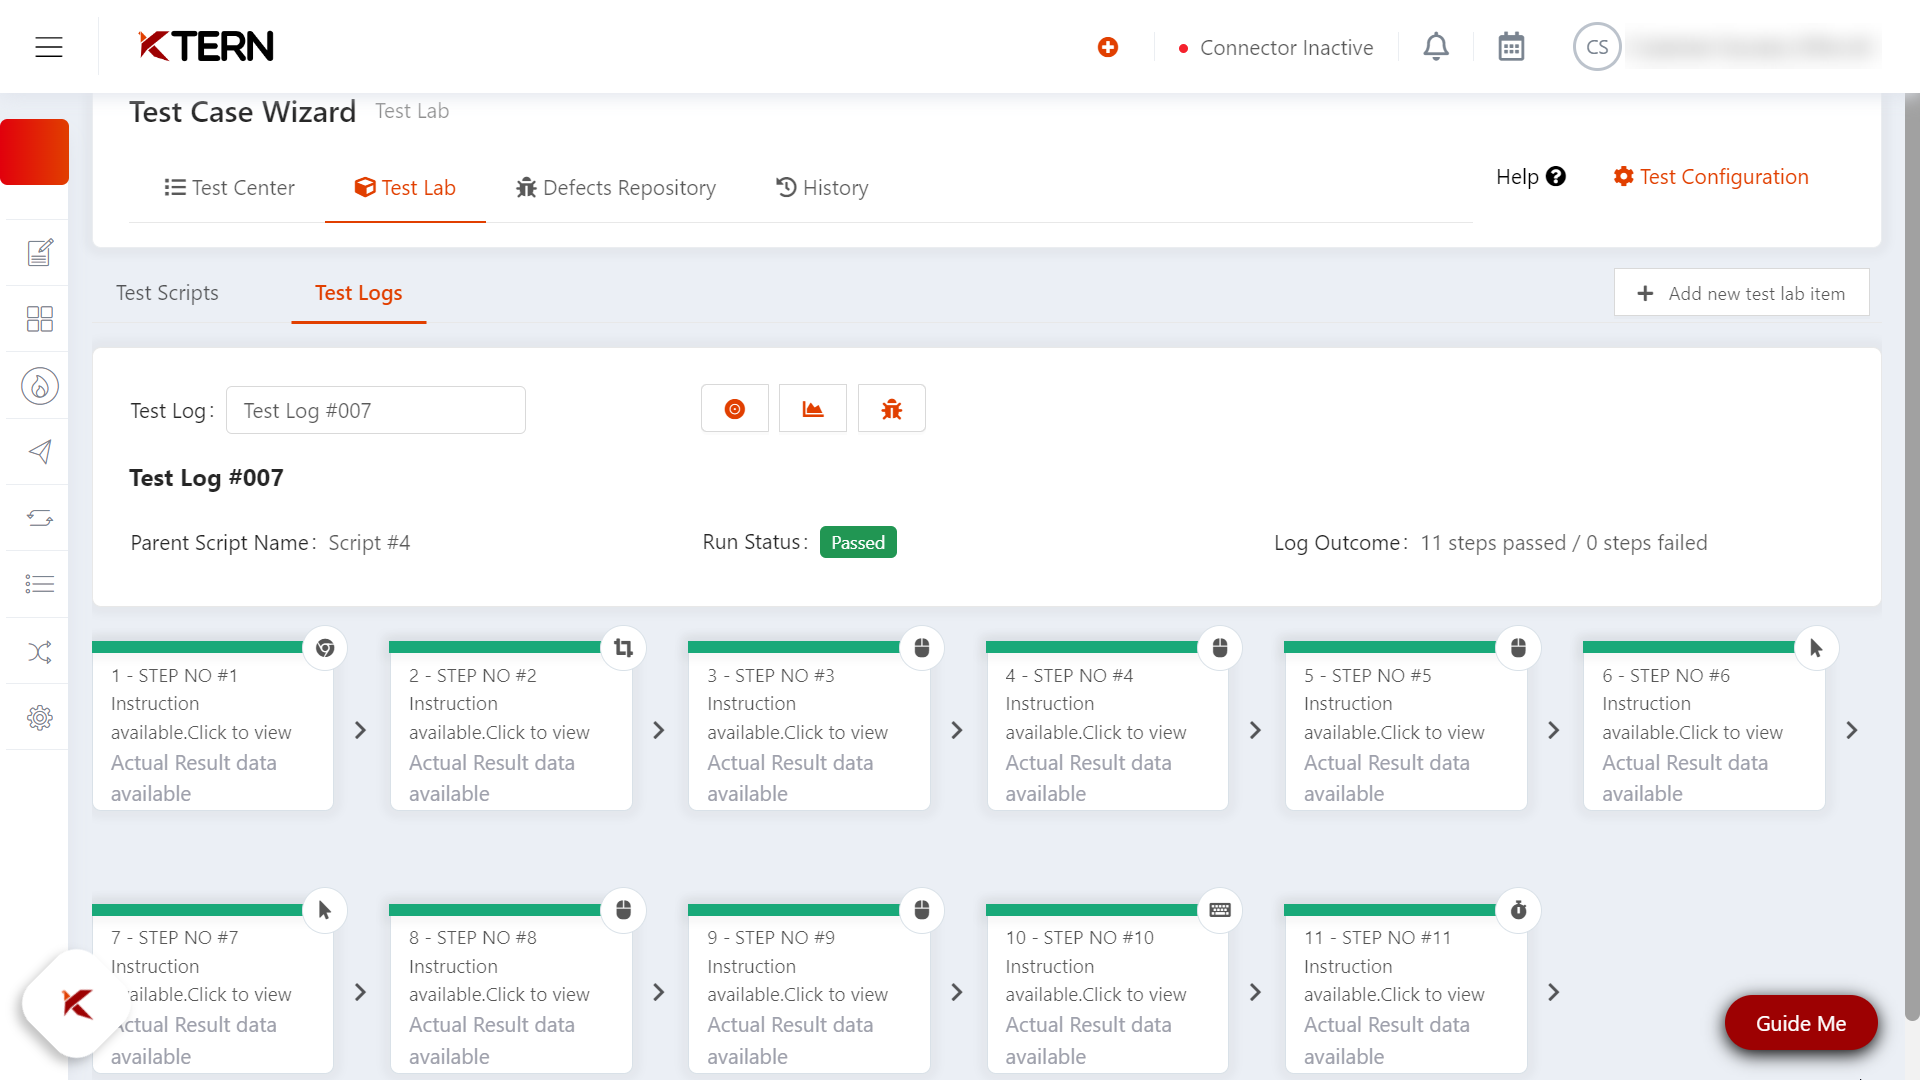
Navigate to the "Test Logs" section within the "Test Lab." Here, user can review crucial information including the parent script's name, run status (whether it passed or failed), and the log outcome detailing the number of successful and unsuccessful steps.
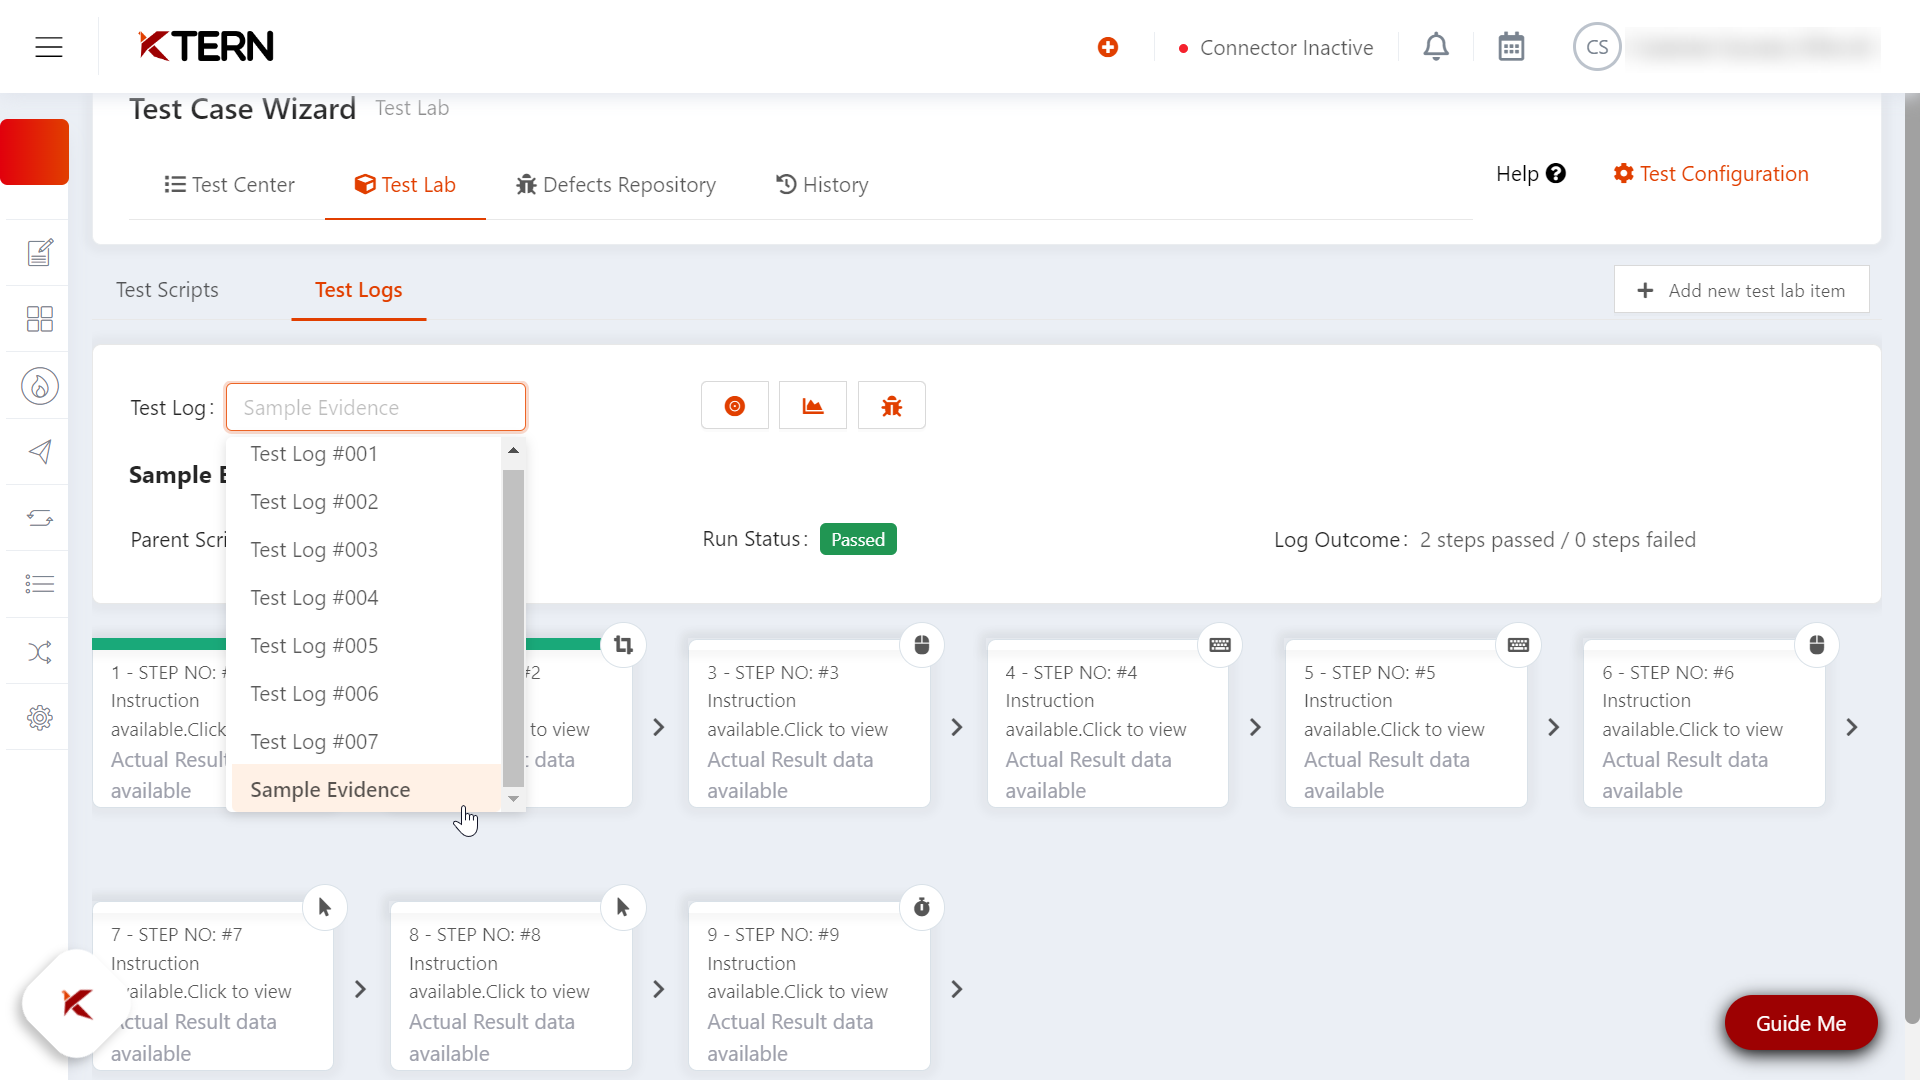
By default, user will land on the screen displaying the execution steps. If needed, they can select and view the status of other test logs.
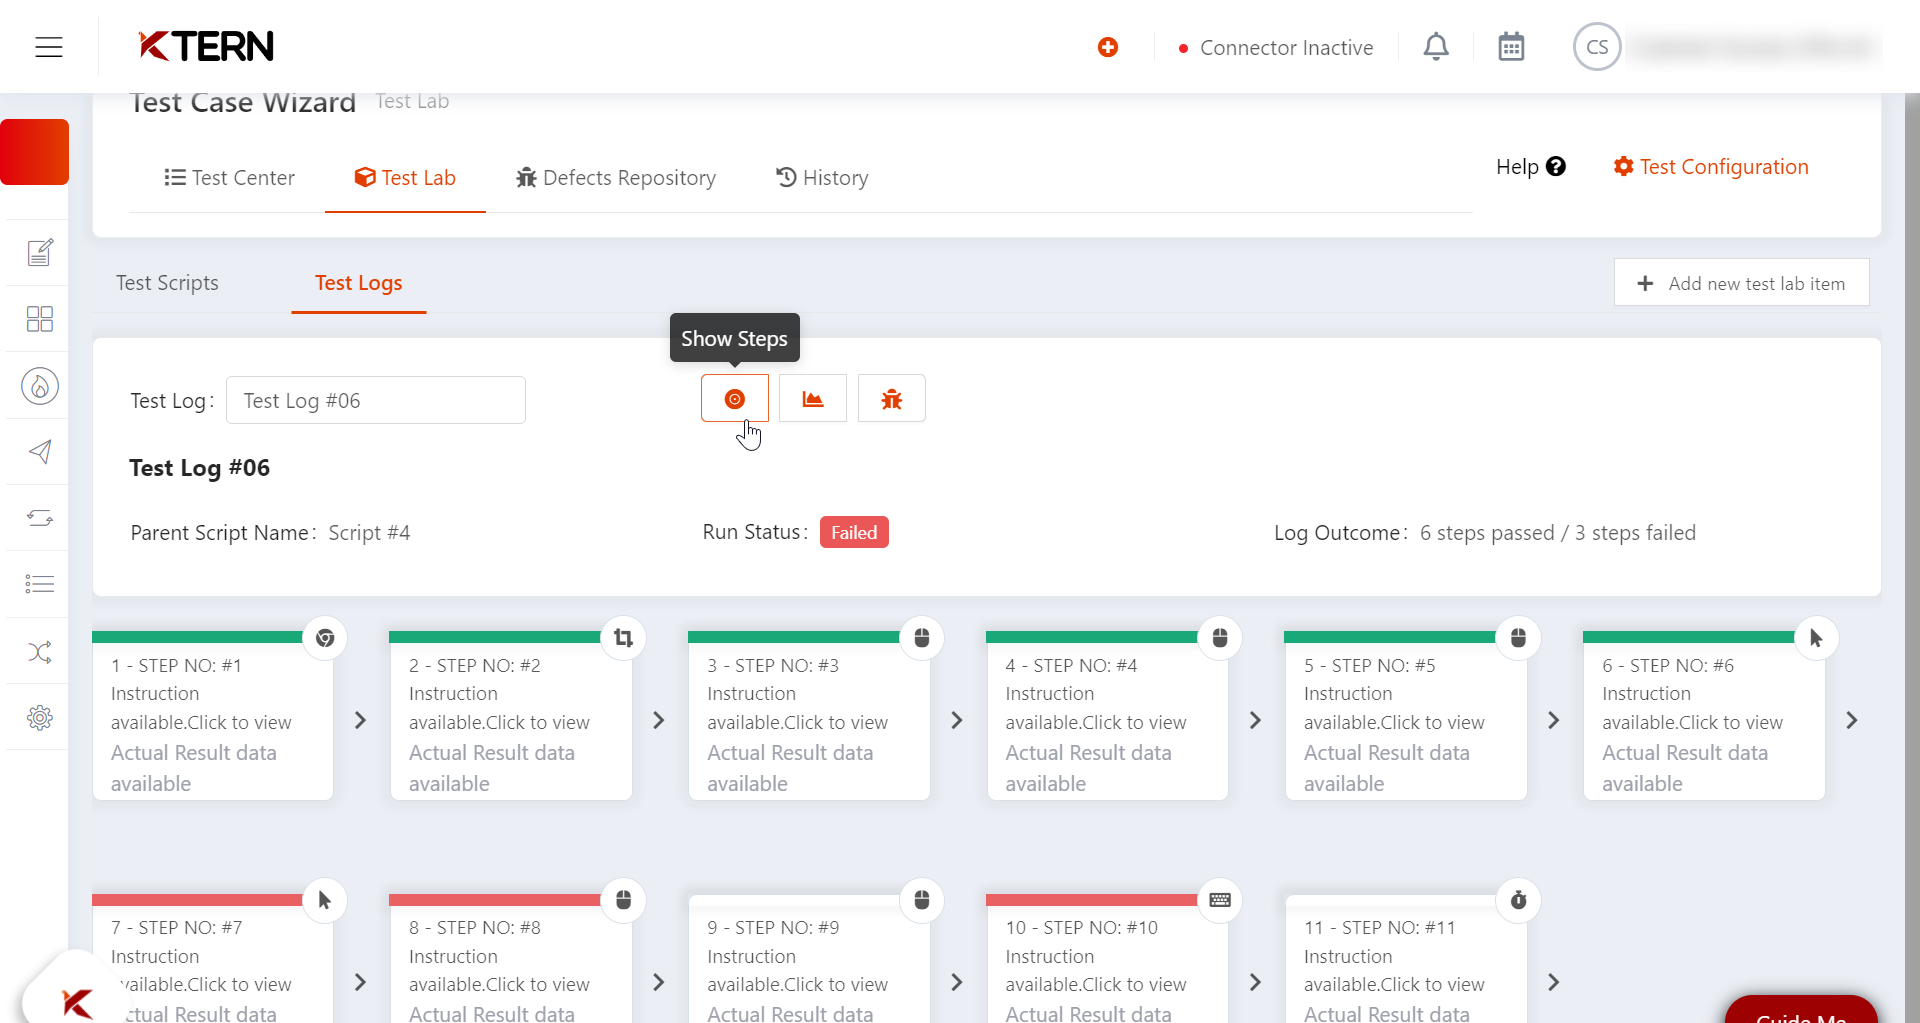
The contrast in the run status of each step is easily noticeable through color coding: green for passed, red for failed, and grey for untested.
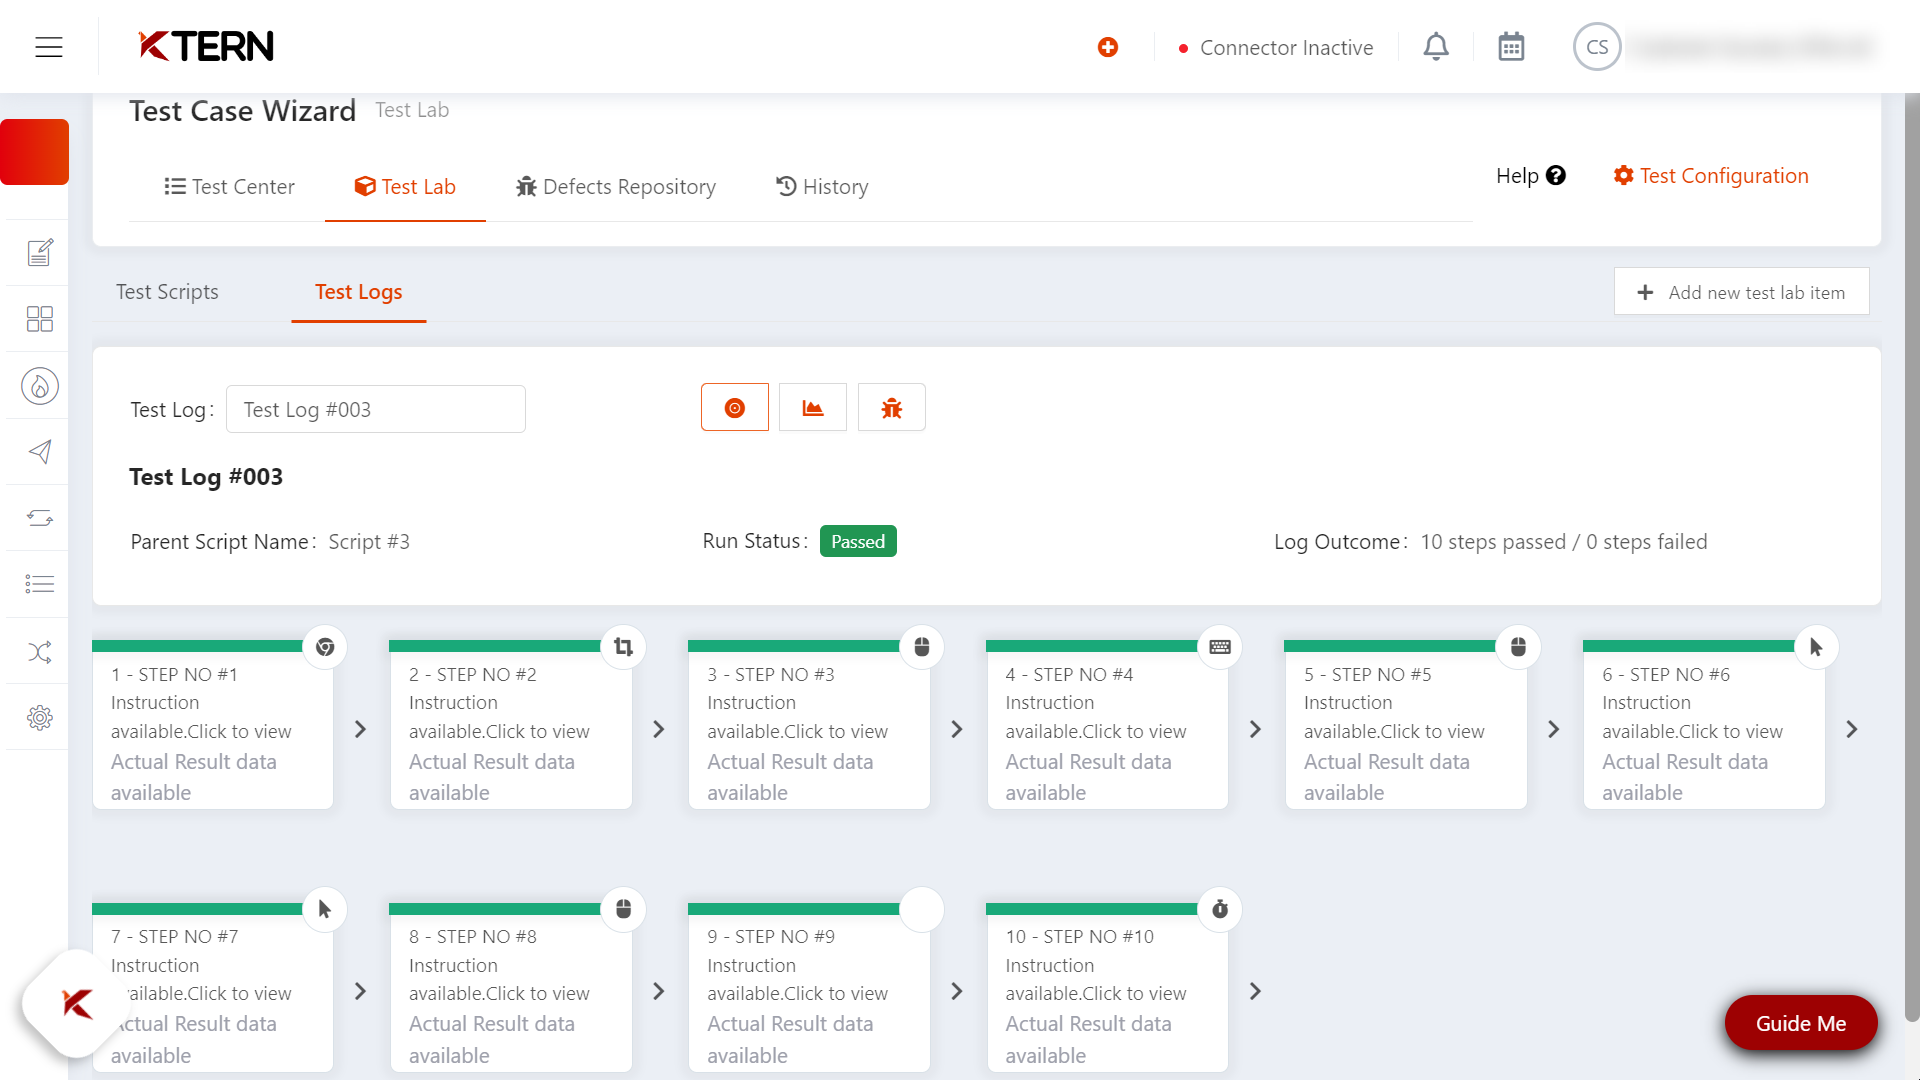
For instance, if all the steps in an execution pass, the overall run status for that test log will be "Passed." However, if any step fails or remains untested, the entire test log status will reflect as "Failed."
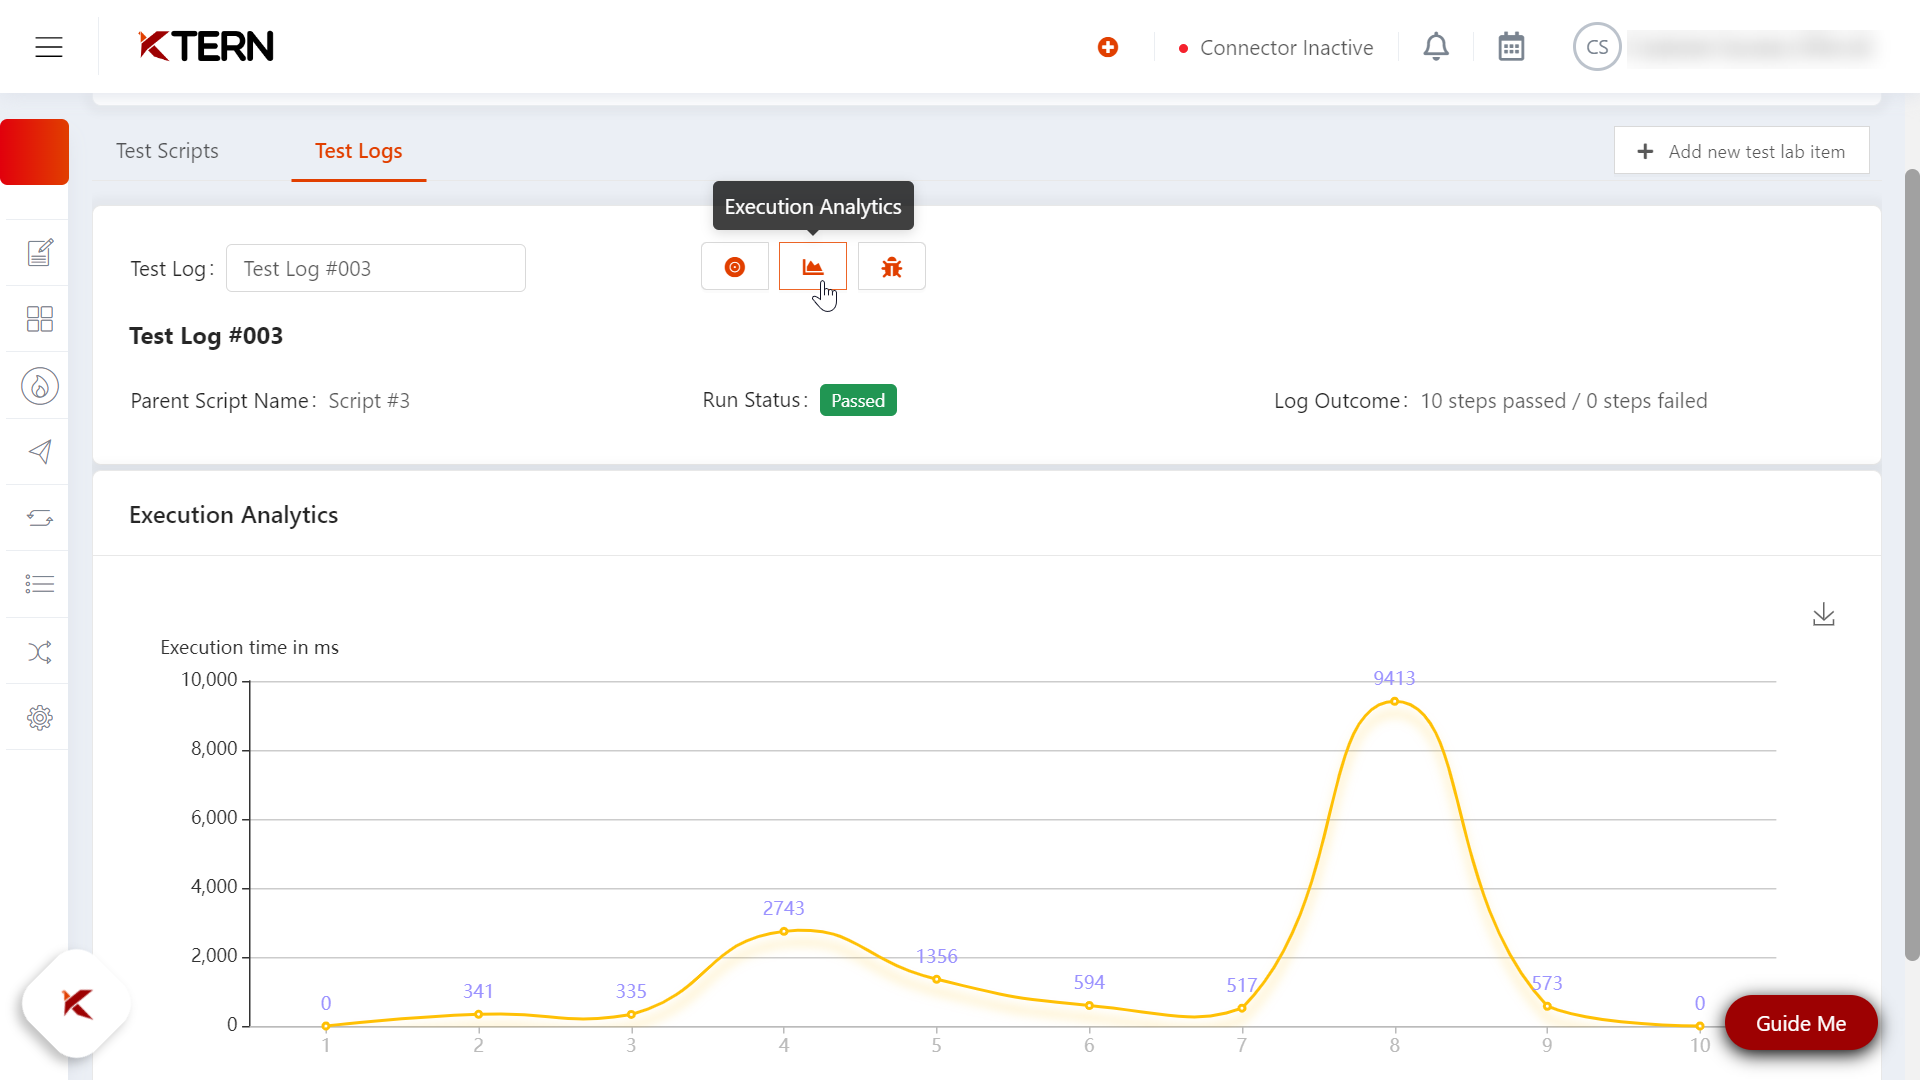
The second icon in the Test Logs section allows the user to access Execution Analytics, presenting the time taken for each step in a visual graph.
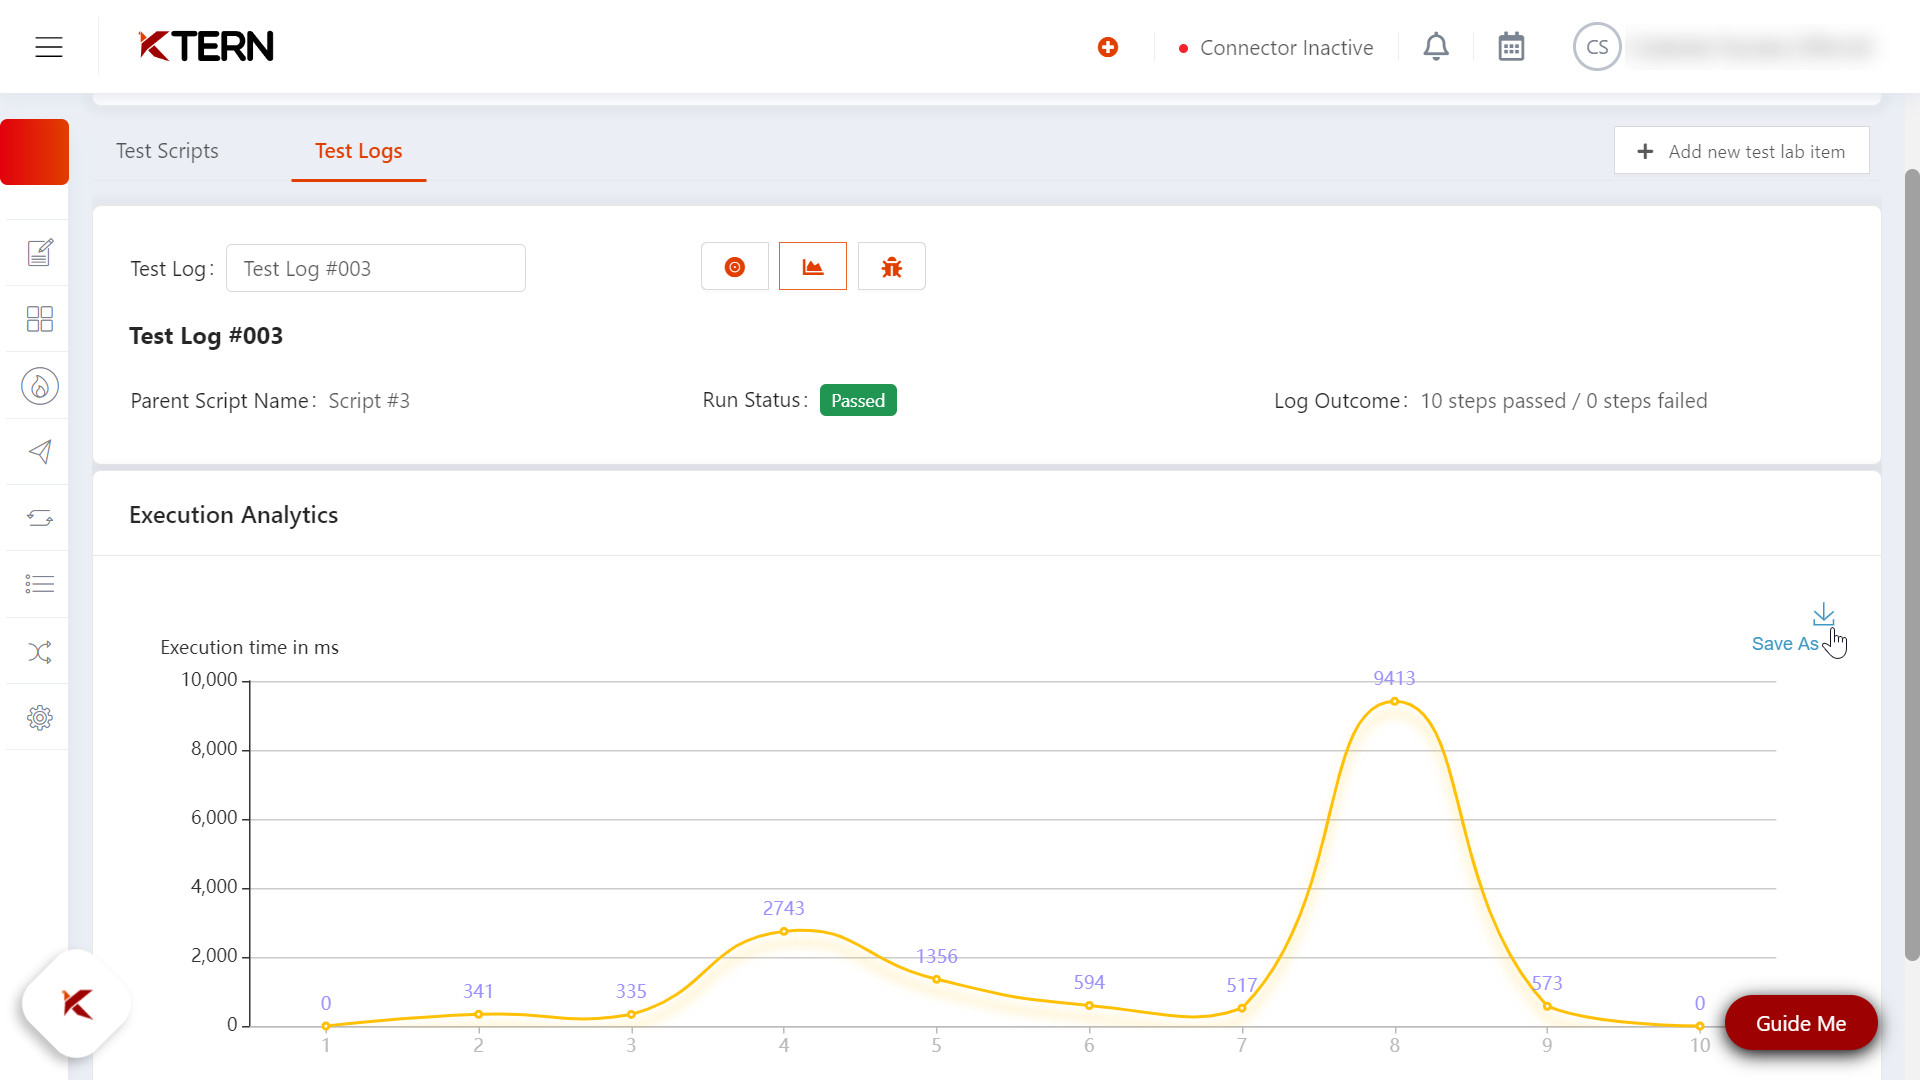
This graphical representation of step execution times can be downloaded using the provided download icon.
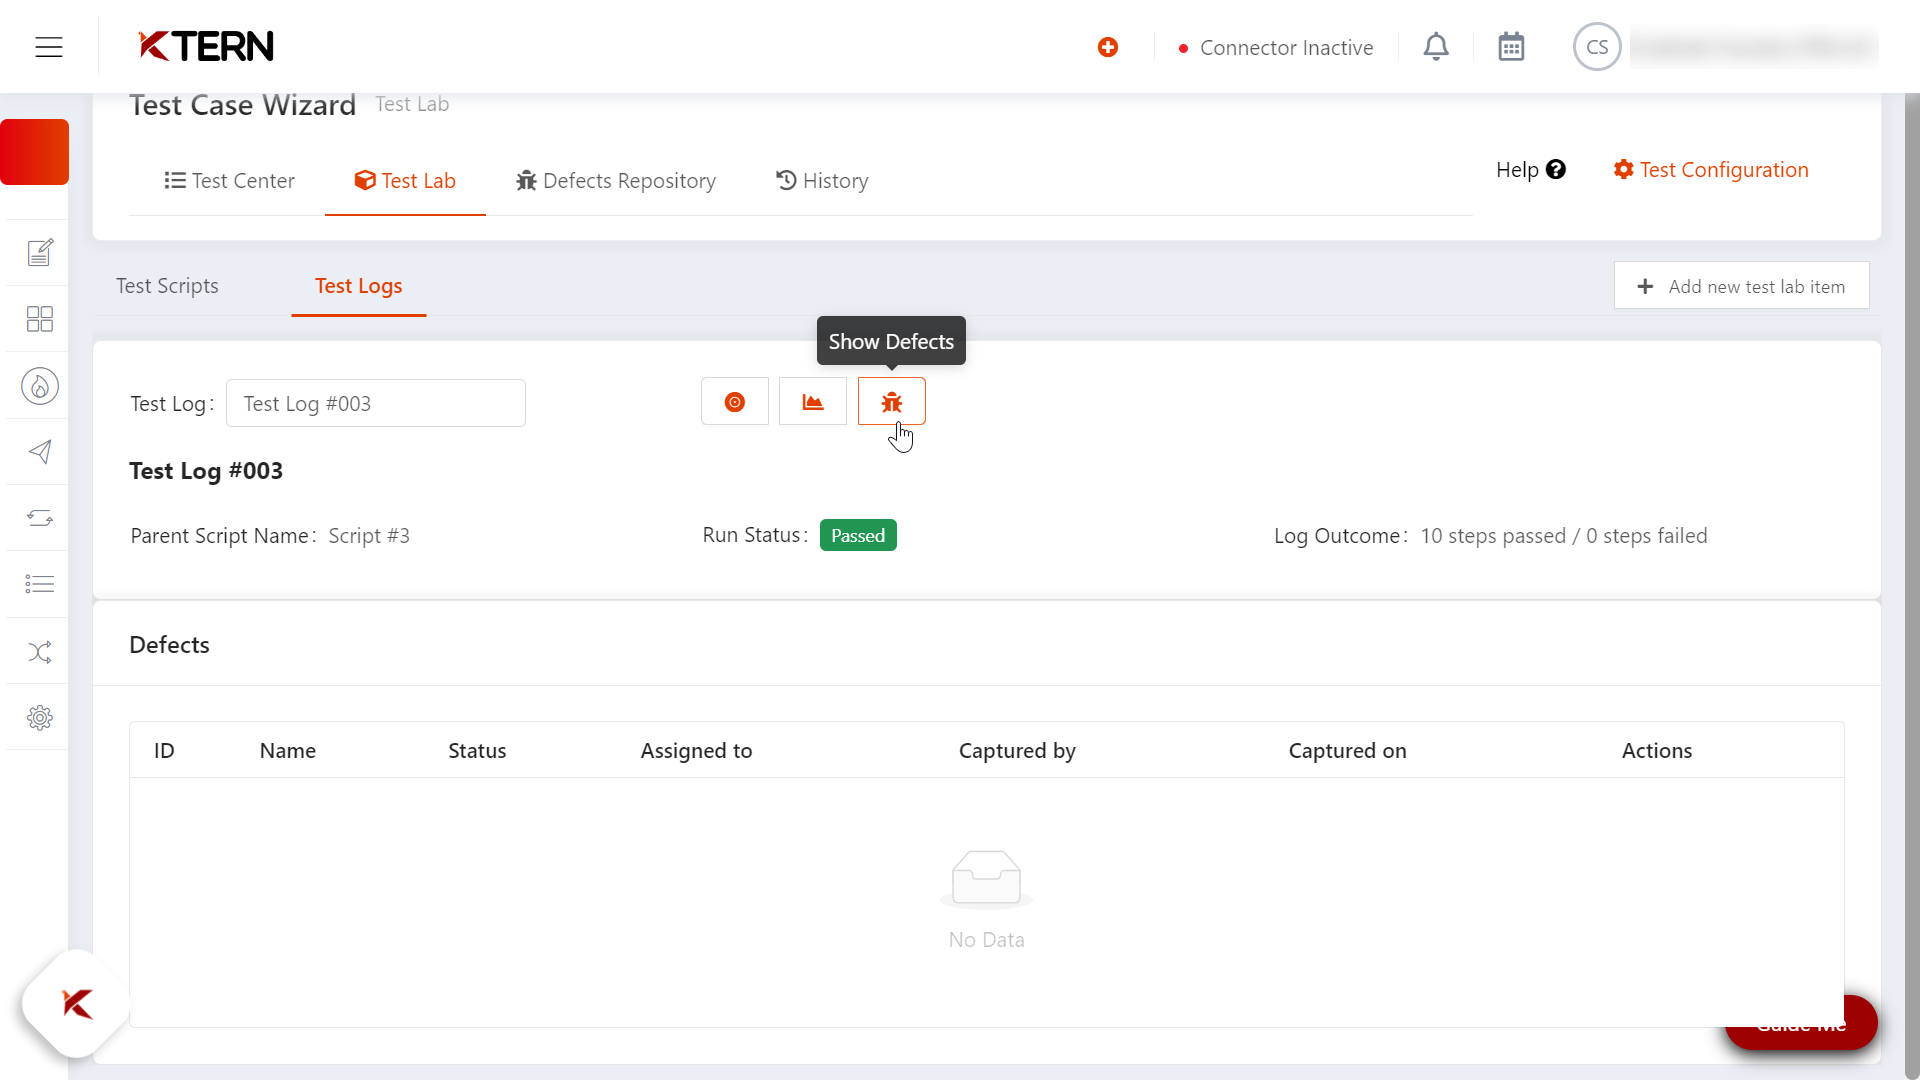
Moving to the third icon, the user can access details about defects associated with the specific test log.