How To Execute Test Plan?
I. Digital Labs Overview
Digital Labs of KTern is tightly integrated with Digital Projects hub, which is the project management suite. Typically, the testers would be testing the various test cases on one side and the governance would take place via emails or chat or any other project management tool. The whole process was cumbersome and arduous for all the stakeholders involved. Therefore, we developed Digital Labs of KTern to execute, manage and collaborate all the testing related activities of an S/4HANA migration/upgrade project from a single place.
- Terminologies used in KTern
- Test Plan: A Test Plan can be defined as a document that defines the scope, objective, and approach to test the software application. The Test Plan is a term and a deliverable. The Test Plan will be designed based on the requirements. While assigning work to the test engineers, due to some reasons one of the testers gets replaced by another one. Here, the Test Plan gets updated.
- Test Scenario: It is a way to define all the possible ways to test an application. It is a single statement to cover all possible ways to test an application.
- Test Case: It is a step by step by procedure that is used to test an application. Test case template includes Test Suit ID, Test Data, Test procedure, Actual results, Expected results etc.
- Test Script: It is a set of instructions to test an application. It is a set of instructions to test an application automatically.
- Test Log: The execution log is a record of the steps executed in the test.
- Defect: A Defect in Software Testing is a variation or deviation of the software application from end user’s requirements or original business requirements. A software defect is an error in coding which causes incorrect or unexpected results from a software program which does not meet actual requirements. Testers might come across such defects while executing the test cases.
- Testing Process in KTern
To ensure effective execution of test cases and governance, it is essential to understand the Testing Process followed by KTern. Starting from Test Case creation to the execution of Test scripts for a test case and raising defects if any issues are found during the execution, it involves a series of steps. - Automatic Test Case Status FormulationAfter each test script execution, the status of the test case will get updated automatically. If all test scripts within a test case pass with all steps' outcomes as 'Passed', the status will be 'Performed'. If any defects are found in any of the test cases, the status will be 'Defect Found'. If multiple scripts are present and one is completed, the status will be 'Active', and the KTern takes the latest added log as the base document for automatic updating.
Automatic Status Update Reference
II. Execution of Test Case
For executing a test case, adherence to the steps outlined in the Testing Process is essential. Test Cases can be launched through both the Transformation Hub and the Test Cockpit.
- Navigating to the Test Case via Transformation Hub
- Click on the Transformation Hub -> Test Cases
- Click the filter icon to apply the required filters, then proceed to click the launch icon to execute the Test Case.
- Navigating to the Test Case via Test Cockpit
- The Test Catalog contains the universal list of all the test plans, test scenarios and test cases. It acts as a launchpad from where you can execute the various test cases.
- The Test Catalog contains the test plans, test scenarios, and the test cases in a hierarchical manner. Each plan can have “n” scenarios under it which in turn can contain “n” test cases. Each of the plan, scenario and test case has a description, related module, testing type and priority assigned adjacent to it.
- Access the Test Cockpit by clicking on it in the side navigation bar. This action will lead you to the Test Cockpit Screen.
- On the Test Catalog screen, you will encounter a tree structure representing test cases. The first-level node represents the Test Plan, the second-level node corresponds to the Test Scenario, and the third-level nodes correspond to individual Test Cases.
- Choose the Test Plan you wish to execute, toggle the scenario, and select the test case to be executed.
- Click on the launch button of the Test Case that needs to be executed.
- Once you click and launch any test case from the test catalog, you will be automatically directed to the Test Case Wizard. The test case wizard consists of some basic information like the status, priority and the test type. It also has the option of editing the test case.
- Click on 'Overview' in the drawer to access and edit the execution title if necessary, then select the appropriate test script from the dropdown menu to be executed.
- Execute step by step, updating the outcome to 'Passed' if successful and 'Failed' if unsuccessful, and add the actual result for each step.
- If a step fails, after updating the outcome to 'Failed', a 'Raise Defect' button will appear. Click on the 'Raise Defect' button to add a defect. If no defect is found, click on 'Add Execution'.
- Add the required Details and click on create button which will create the defect against that testcase.
- After creating the defect for that step, you can either click on the 'Add Execution' button, as shown in the image below, or proceed with the next steps if the previous defect does not halt the execution. Once completed, click on the 'Add Execution' button.
III. Monitoring the Test Logs
Once the Test Log is generated, you can access it by navigating to the 'Test Lab' tab followed by selecting the 'Test Logs' tab. Multiple test logs may exist for a test script. They are accessible through a dropdown menu, enabling you to switch between logs and view them as needed.
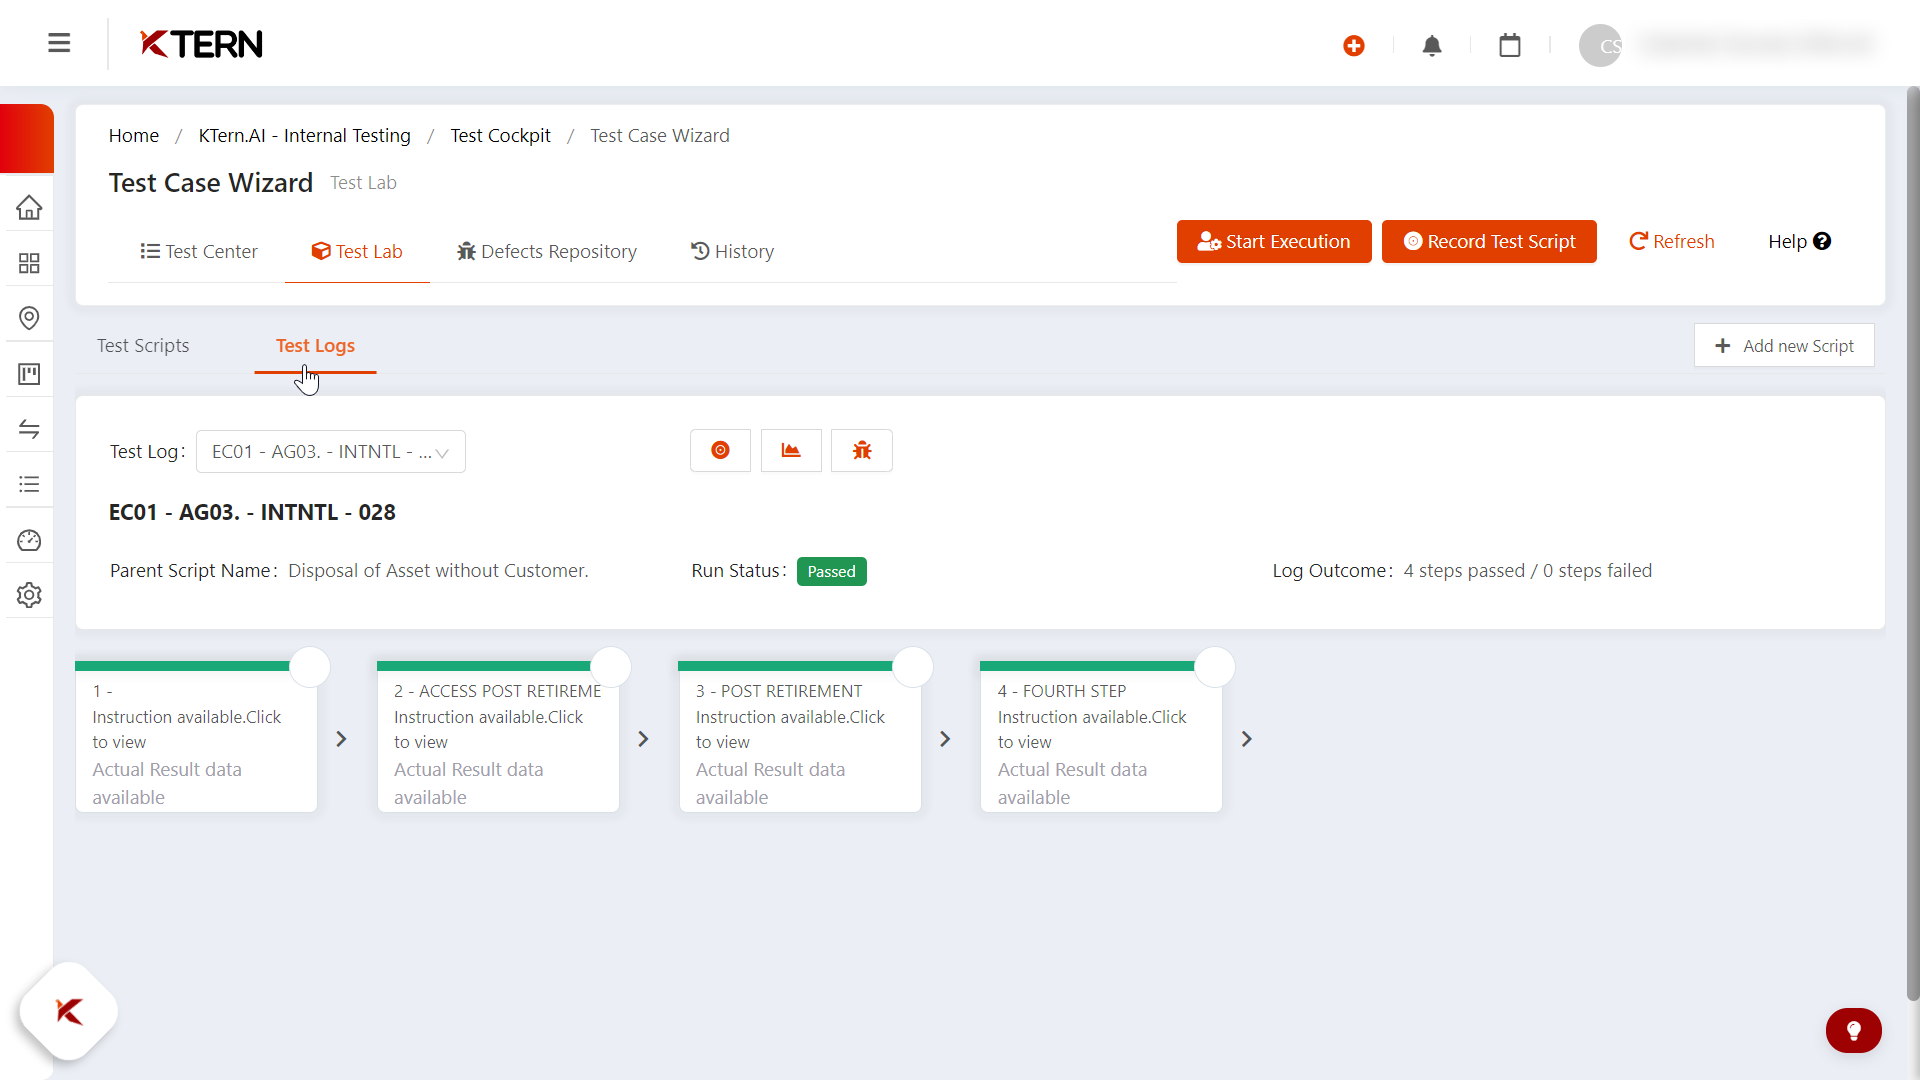
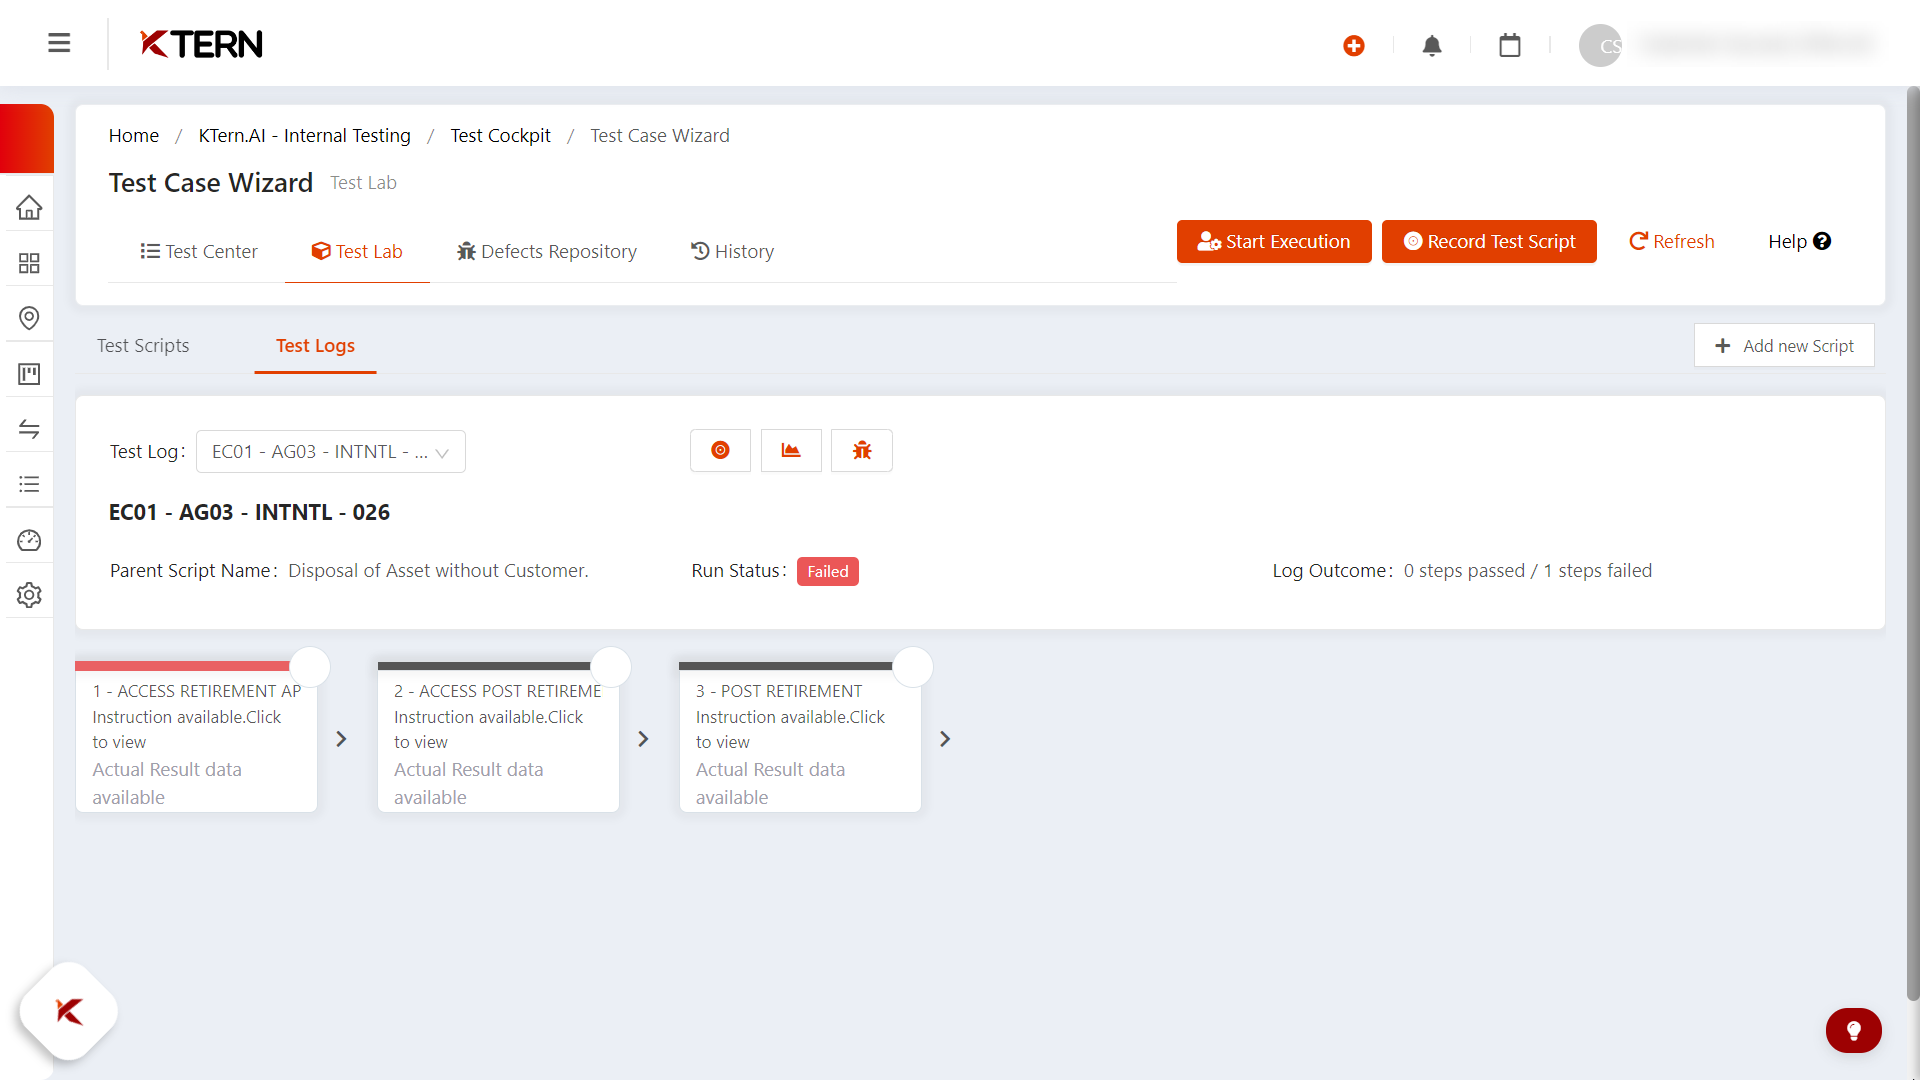
Note: If all steps in a test script pass, the overall status will be 'Passed'; otherwise, it will be 'Failed'. A passed step will be highlighted in green, a failed step in red, and an untested step in grey.
- Navigating to the Defects via Test Case Wizard
- Click on the launch button of the Test Case that the logs to be monitored.
- Navigate to the "Defects Repository" tab after the wizard has loaded, where you'll find a list of all defects assigned to the specific test case.
- Navigating to the Defects via Transformation Hub
- Click on the Transformation Hub -> Issues.
- Clicking on the issues will redirect you to the Issue landing page, where all issues created in the project are listed.
- Utilize the available filters to refine the displayed issues according to your requirements.
- Additionally, you can search for specific issues using their titles.
- Upon clicking the launch button, as depicted in the figure below, you will be directed to the issue drawer screen.
- The image below illustrates the issue drawer screen. Here, you have the option to download the issue as a document and edit it. The "Overview" tab describes the issue.
- You can download the issue as a document and also can edit an issue using the pencil icon.
Related Articles
Best Practice Guide For SAP Digital Labs With KTern.AI
I. Digital Labs Overview Digital Labs by KTern.AI offers a comprehensive solution for streamlining testing processes and ensuring successful outcomes in SAP Digital Transformations. This guide outlines best practices for leveraging Digital Labs to ...How To Run Unit Test And String Test Using KTern?
I. Create Test Cases Using Clone and Create The primary purpose of 'clone and create' functionality is to streamline the creation of process activities by integrating the project plan with tasks, issues, test cases, sign-offs, and meetings. This ...Best Practice Guide for SAP Digital Projects With KTern.AI
I. My Projects - Controlled Planning and Execution 1. Transformation Hub - Users Empowering Project Management: Best Practices for User and Access Management in KTern In today's dynamic project environments, efficient collaboration and streamlined ...How Will You Manage The Issues Lifecycle?
I. Introduction In this section, we provide an overview of issue management in KTern.AI, highlighting its importance in project management and the benefits it brings to users. Overview of Issue Management in KTern.AI Issue management in KTern.AI ...How Do You Configure WRICEF In KTern.AI?
To effectively govern WRICEF development, it's essential to understand the process of creating and maintaining these components within KTern. I. Transformation Hub - Backlog WRICEF Creation as Backlog To effectively govern the WRICEF development ...